Fraser Valley Market Report Infographics
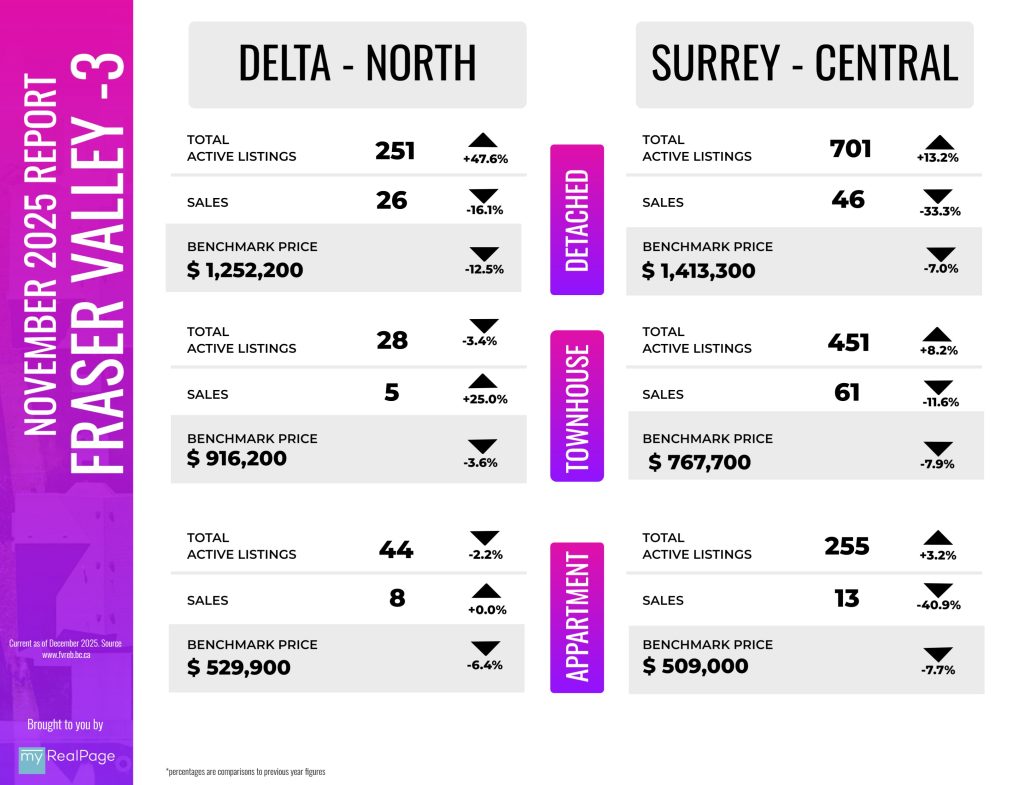
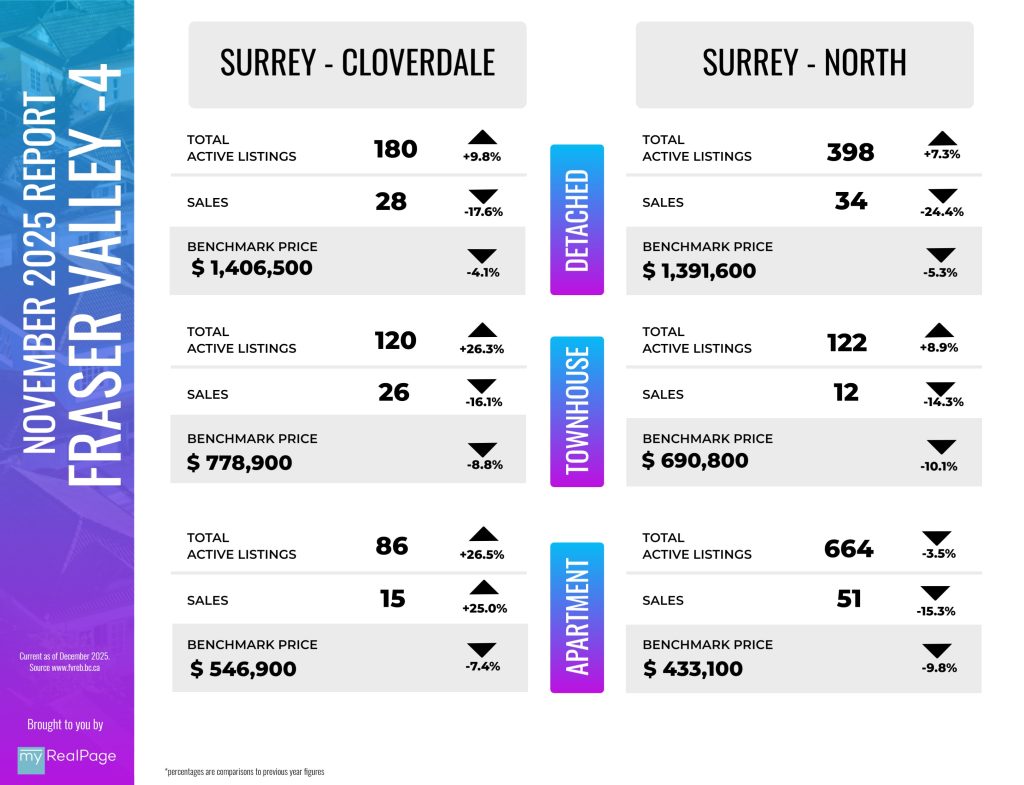
INFOGRAPHICS: November 2025 FVREB Fraser Valley Market Reports
Early fall momentum slows as Fraser Valley sales dip in November
Easing prices and abundant inventory weren’t enough to entice buyers to the Fraser Valley market in November, as sales declined in line with seasonal buying patterns.
The Fraser Valley Real Estate Board recorded 943 sales on its Multiple Listing Service® (MLS®) in November, a 16 per cent decrease from October, and 17 per cent below sales from the same month last year.
New listings slowed again in November, down 26 per cent month-over-month and seven per cent year- over-year, to 2,210. Overall inventory remains well above seasonal norms for the Fraser Valley, with 9,201 active listings, down nine per cent from October and 47 per cent above the 10-year seasonal average.
“Affordability concerns and economic pressures are weighing heavily on many Fraser Valley households,” said Tore Jacobsen, Chair of the Fraser Valley Real Estate Board. “Our REALTORS® understand how personal and complex these decisions are. But there are encouraging signs for buyers. Composite prices are closer to early-2023 levels, inventory has improved, and there is more space to negotiate than we’ve had in recent years.”
Read the full report on the FVREB website!
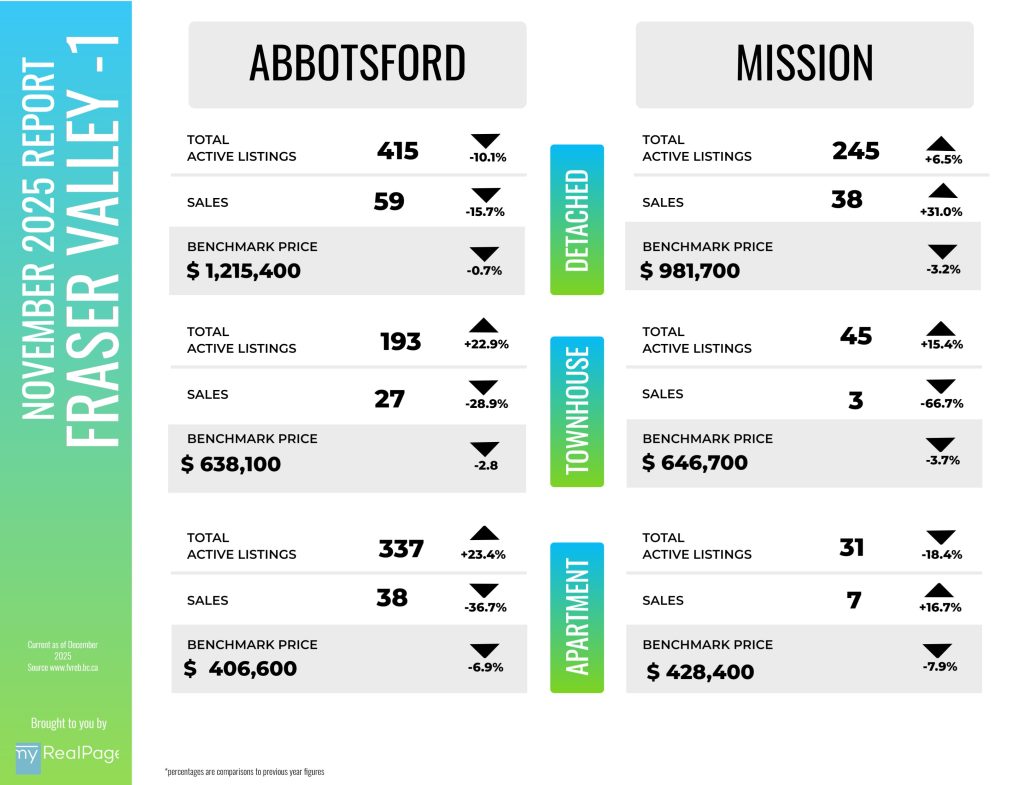
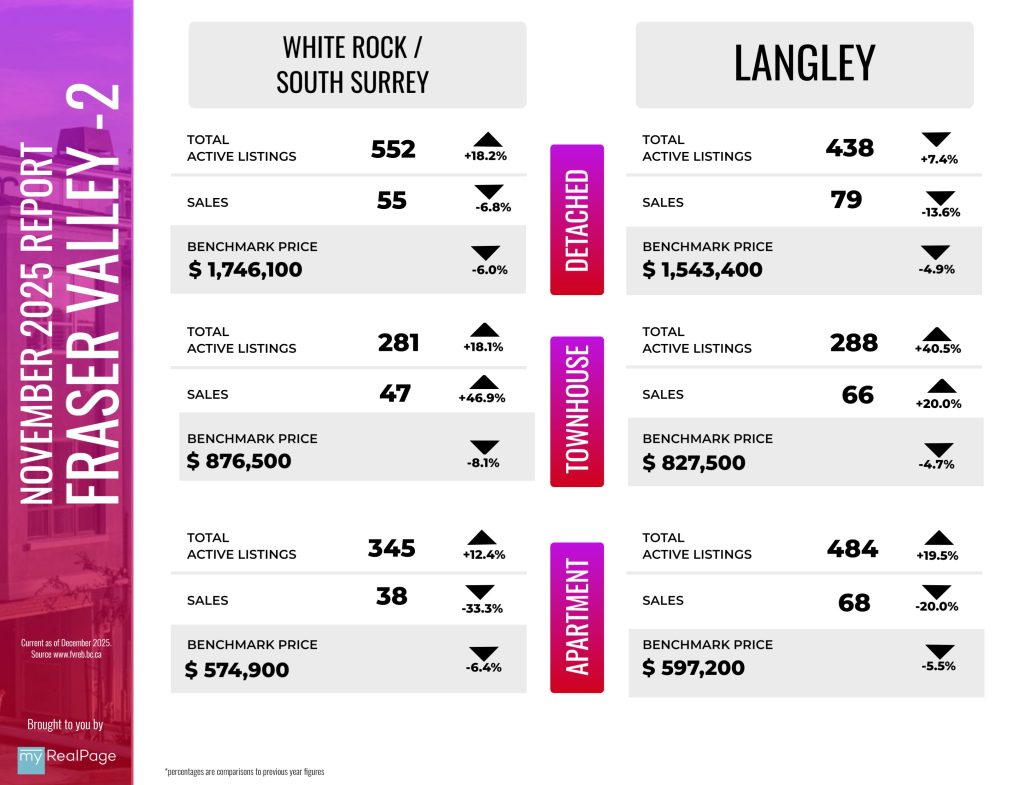
The following data is a comparison between November 2025 and November 2024 numbers, and is current as of December of 2025. For last month’s report, check out our previous infographic!
Or follow this link for all our FVREB Infographics!
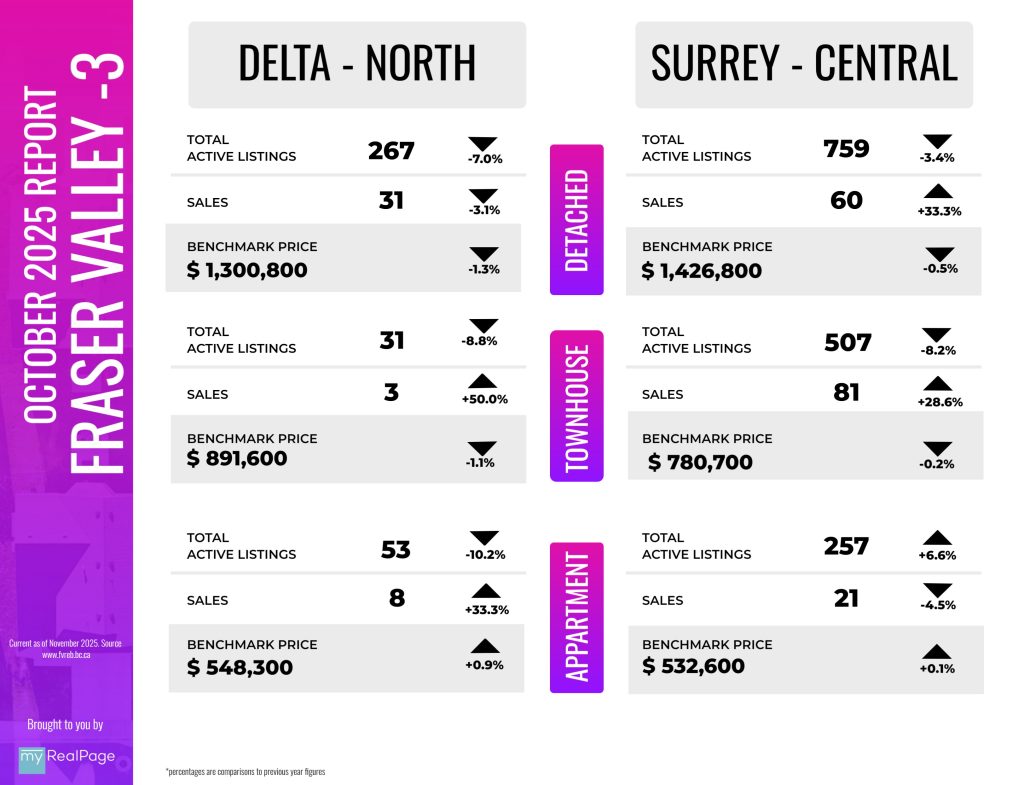
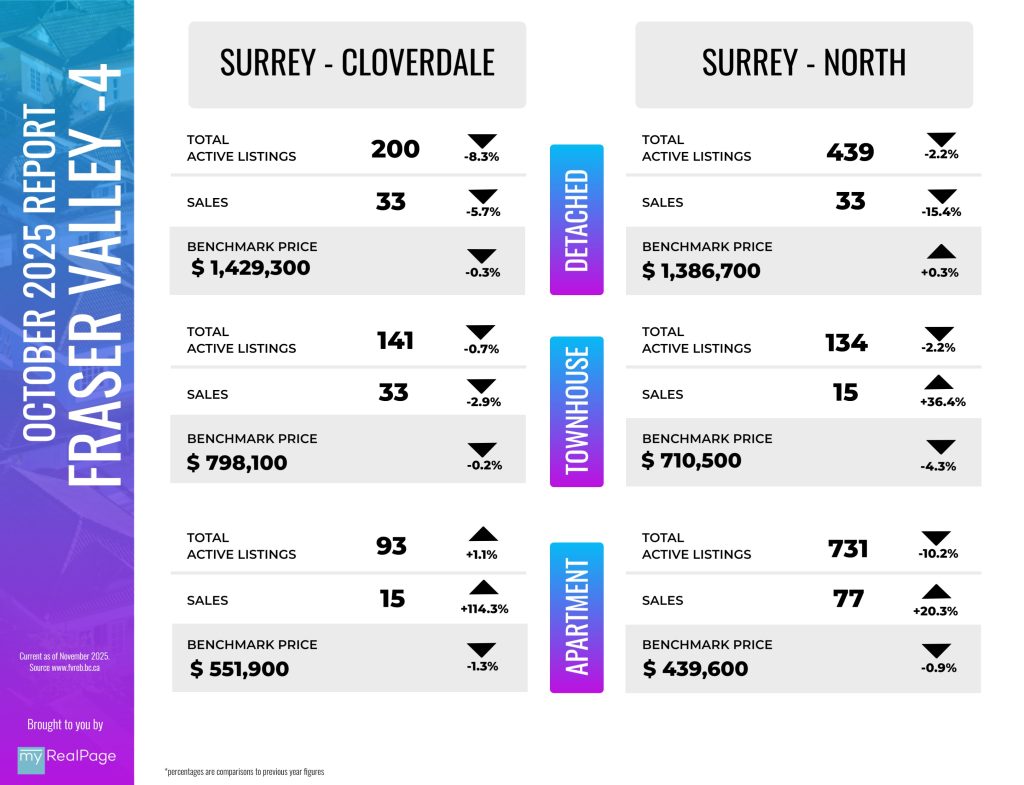
These infographics cover current trends in Fraser Valley neighbourhoods that are within the FVREB. Click on the images for a larger view!
Download Printable Version – FVREB November 2025 Market Report
INFOGRAPHICS: October 2025 FVREB Fraser Valley Market Reports

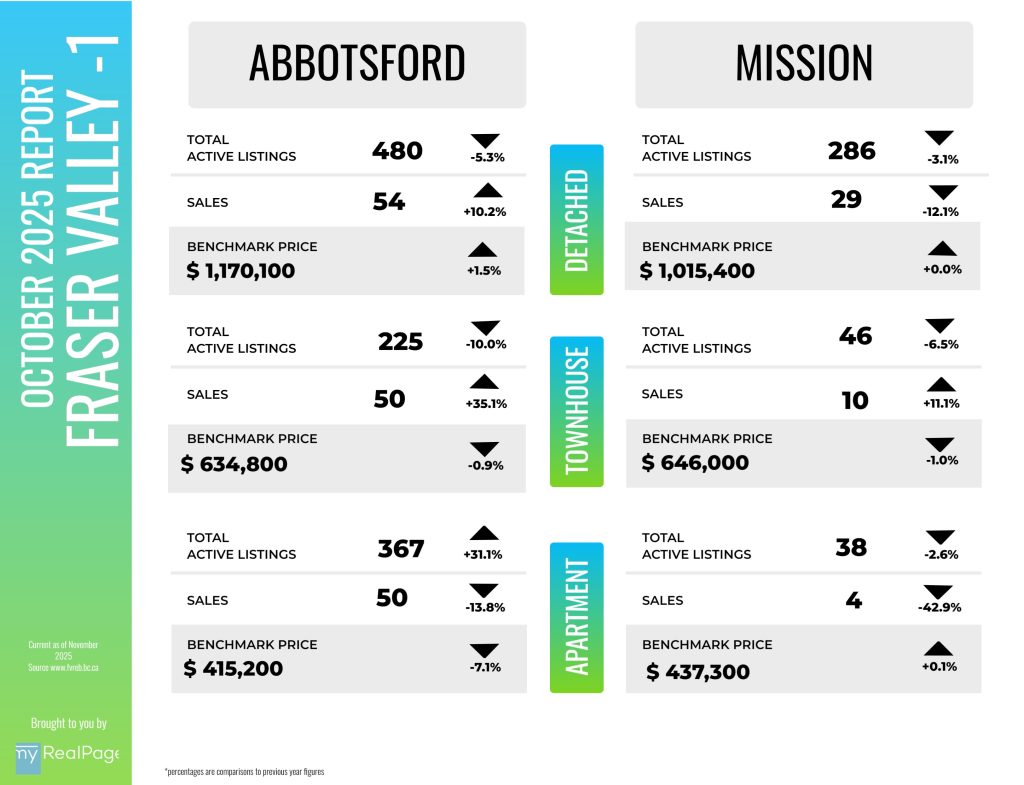
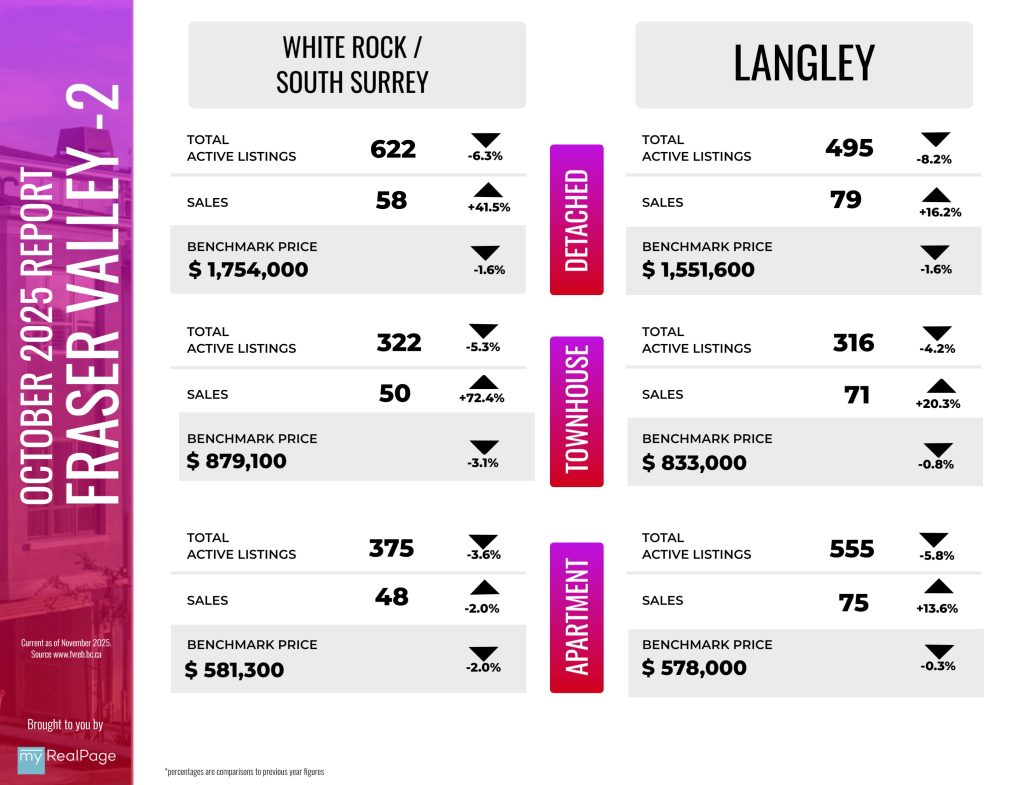
October brings welcome boost to Fraser Valley, but sales still lag seasonal averages
Fraser Valley home sales climbed for the second straight month in October, a sign that some buyers may be responding to steadily easing prices.
The Fraser Valley Real Estate Board recorded 1,123 sales on its Multiple Listing Service® (MLS®) in October, a 17 per cent increase from September, but 16 per cent below sales from the same month last year. After a short-lived rise in September, new listings slowed in October, down 14 per cent month-over-month and seven per cent year-over-year, to 2,967. Overall inventory remains well above seasonal norms for the Fraser Valley, with 10,121 active listings, down four per cent from September but up 15 per cent year-over-year.
“Motivated sellers are responding to increasingly competitive market conditions with more realistic pricing strategies,” said Tore Jacobsen, Chair of the Fraser Valley Real Estate Board. “As a result, we’re seeing prices soften—a shift that’s helping to facilitate sales in a slower market.”
Read the full report on the FVREB website!
The following data is a comparison between October 2025 and October 2024 numbers, and is current as of November of 2025. For last month’s report, check out our previous infographic!
Or follow this link for all our FVREB Infographics!
These infographics cover current trends in Fraser Valley neighbourhoods that are within the FVREB. Click on the images for a larger view!
Download Printable Version – FVREB October 2025 Market Report
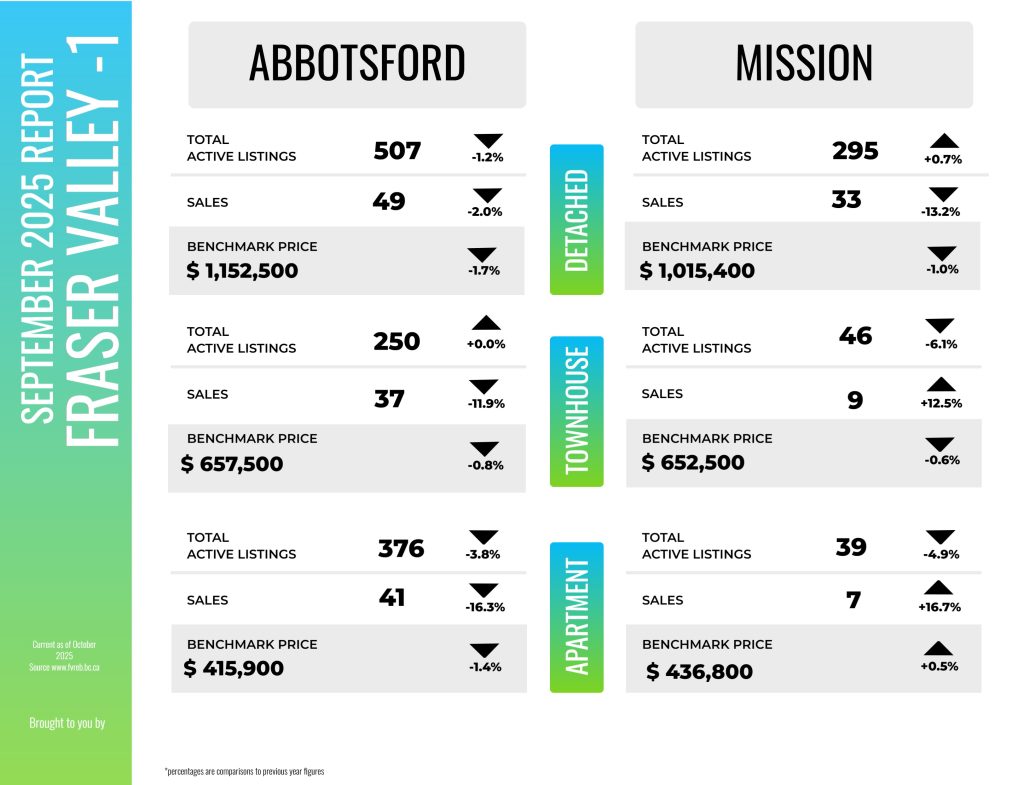
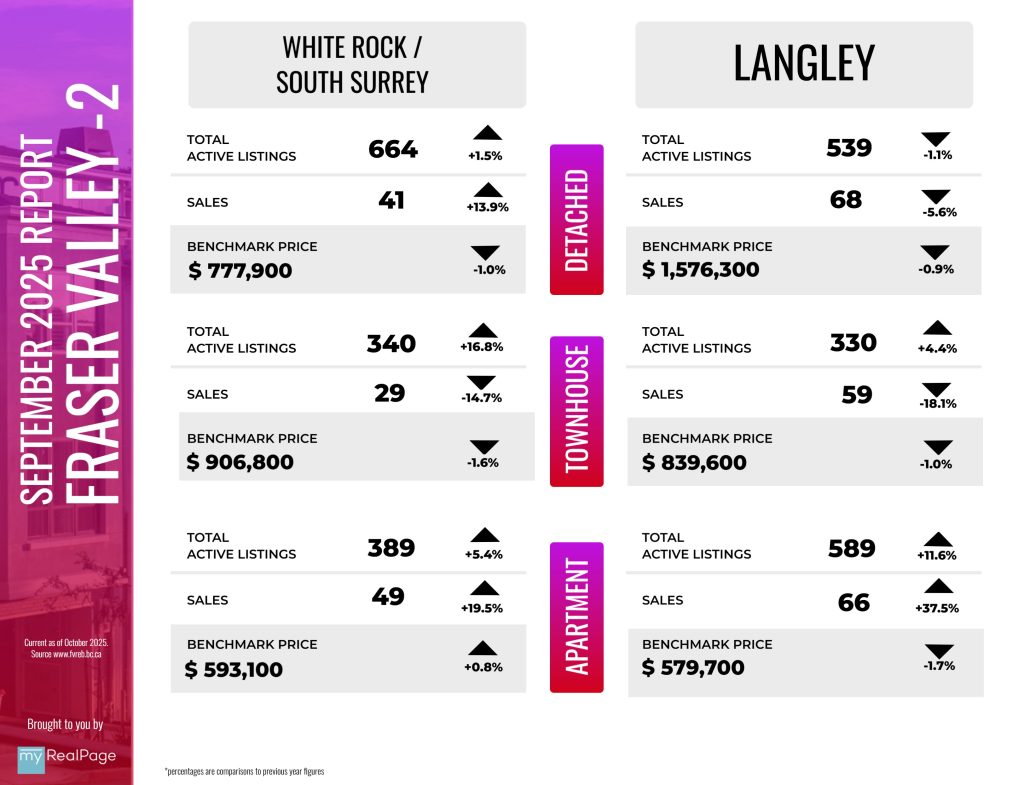
INFOGRAPHICS: September 2025 FVREB Fraser Valley Market Reports

Sustained elevated inventories soften Fraser Valley home prices further, spurring bump in sales
Home prices in the Fraser Valley continued their downward trend in September, marking the sixth straight month of declines, amid high inventory.
The Benchmark price for a typical home in the Fraser Valley dropped one per cent in September to $926,300, down 5.4 per cent year-over-year. The continued softening of prices may be encouraging some buyers back into the market, as the Fraser Valley Real Estate Board recorded 962 sales on its Multiple Listing Service® (MLS®) in September, an increase of three per cent over August. September sales were down two per cent year-over-year and 28 per cent below the 10-year average.
“As prices continue to weaken, the market is showing hopeful signs of renewed confidence,” said Tore Jacobsen, Chair of the Fraser Valley Real Estate Board. “While recent economic uncertainty seems to have weighed more heavily here in the Fraser Valley, some buyers are beginning to re-engage in the market, a positive signal heading into the fall.”
Read the full report on the FVREB website!
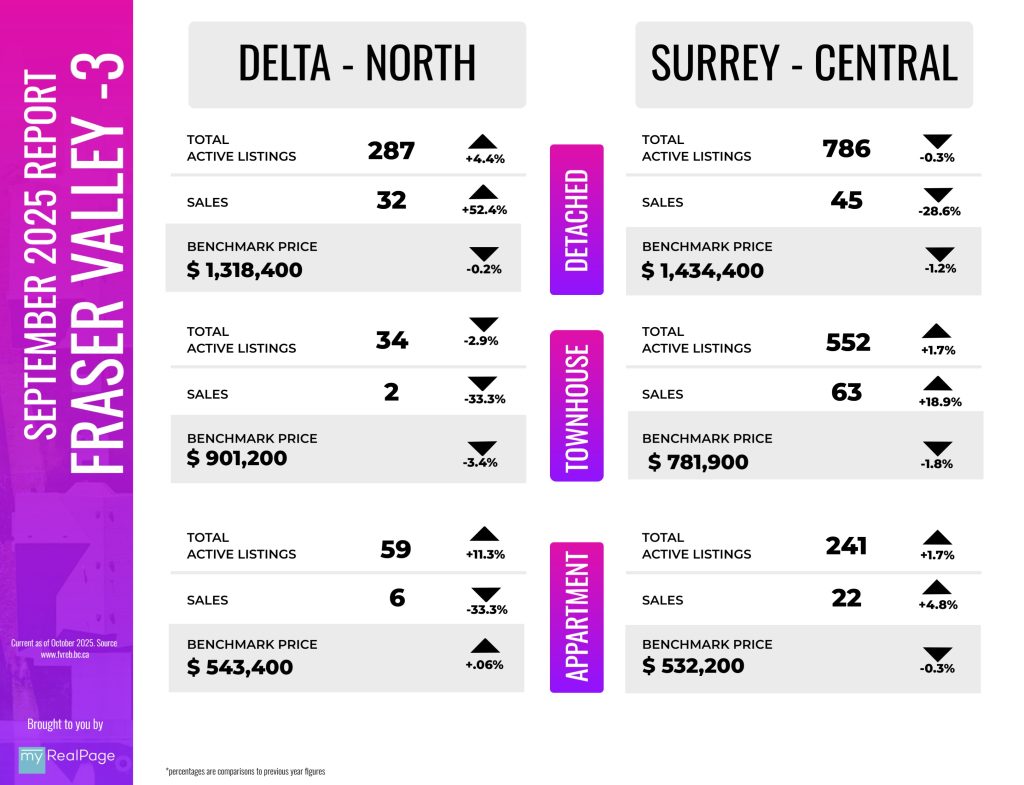
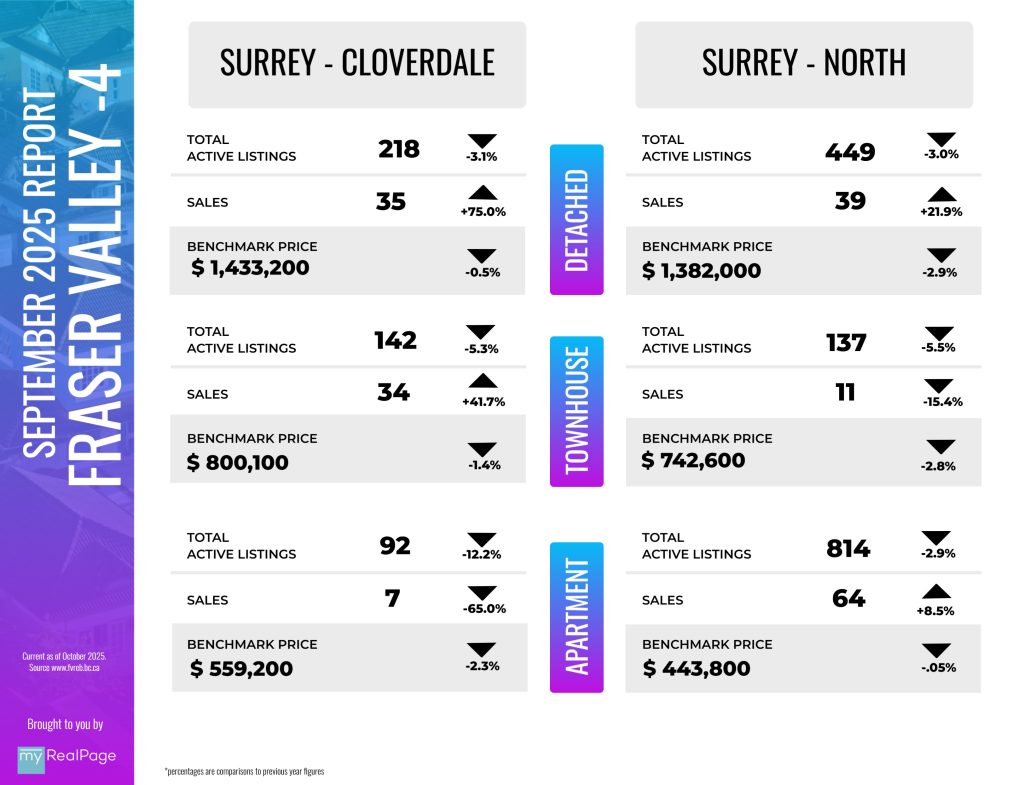
The following data is a comparison between September 2025 and September 2024 numbers, and is current as of October of 2025. For last month’s report, check out our previous infographic!
Or follow this link for all our FVREB Infographics!
These infographics cover current trends in Fraser Valley neighbourhoods that are within the FVREB. Click on the images for a larger view!
Download Printable Version – FVREB September 2025 Market Report
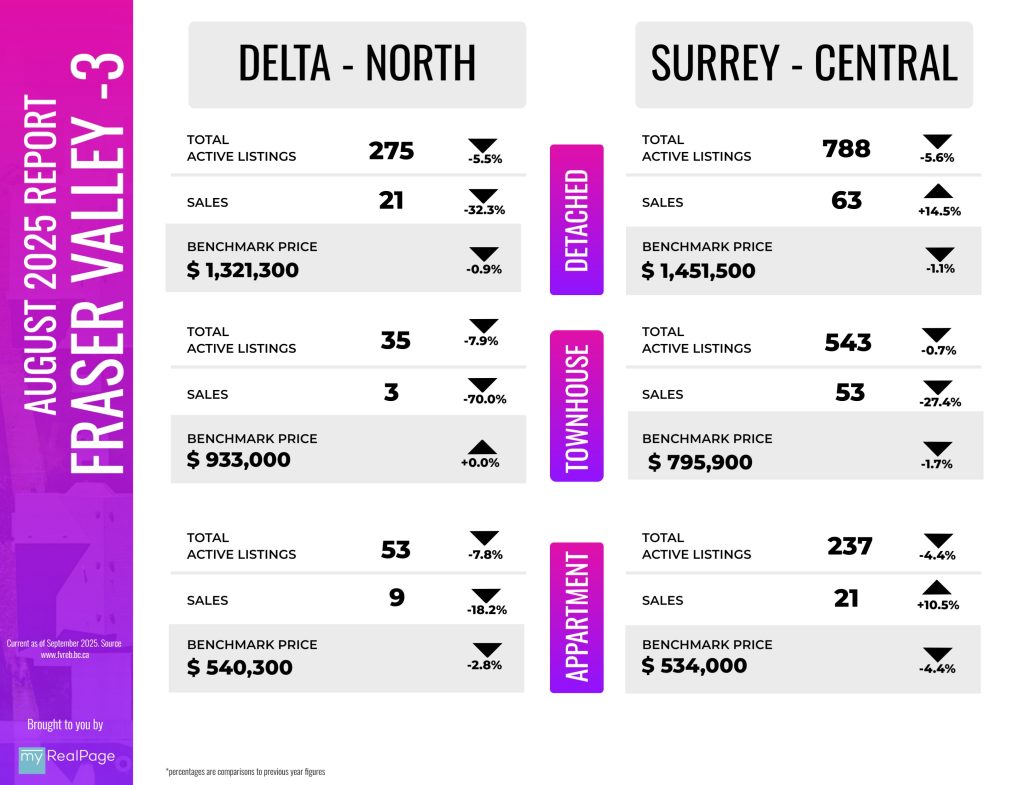
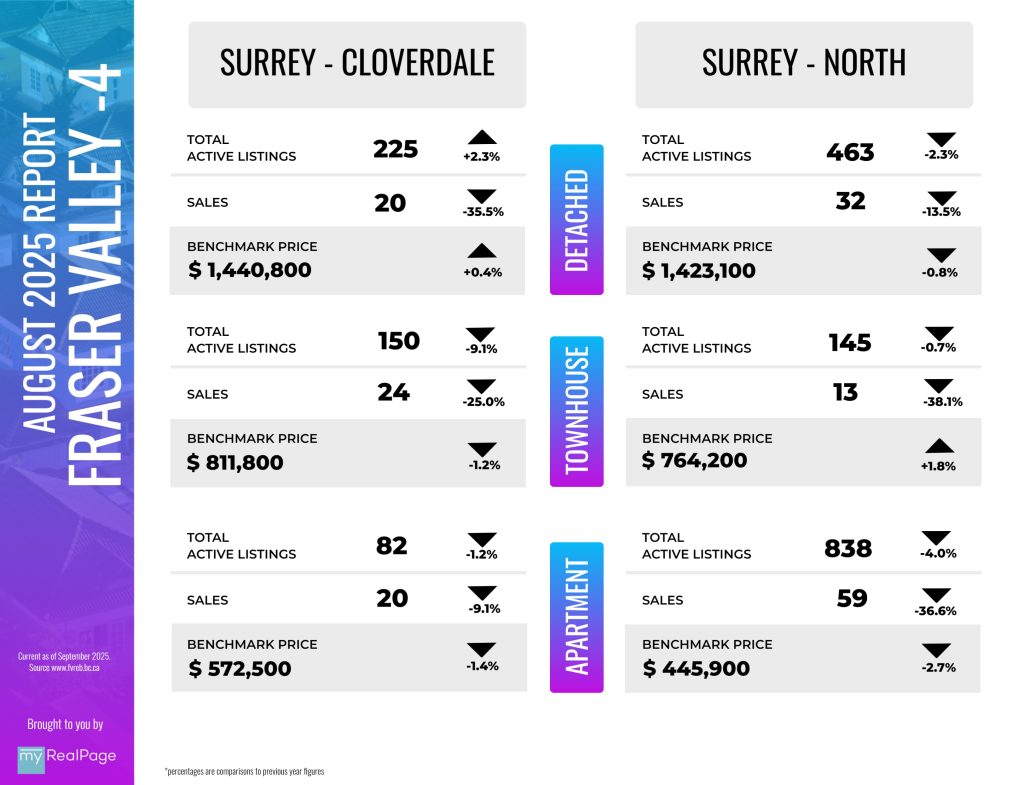
INFOGRAPHICS: August 2025 FVREB Fraser Valley Market Reports

Declining prices and high inventory strengthen buyer’s market heading into fall
Fraser Valley home sales fell more than 20 per cent in August, but buyers who did get into the market were able to take advantage of favourable conditions including abundant choice, softer prices and more time to make decisions.
The Fraser Valley Real Estate Board recorded 931 sales on its Multiple Listing Service® (MLS®) in August, down 22 per cent from July and down 13 per cent year-over-year. August sales were 36 per cent below the 10-year average.
The Fraser Valley buyer’s market remains strong with inventory levels holding relatively stable, down just two per cent to 10,445 active listings. Newly listed homes declined 19 per cent month-over-month to 2,793; up half a per cent year-over-year. The overall sales-to-active listings ratio for August dropped to nine per cent, down two per cent from July. The market is considered balanced when the ratio is between 12 per cent and 20 per cent.
Read the full report on the FVREB website!
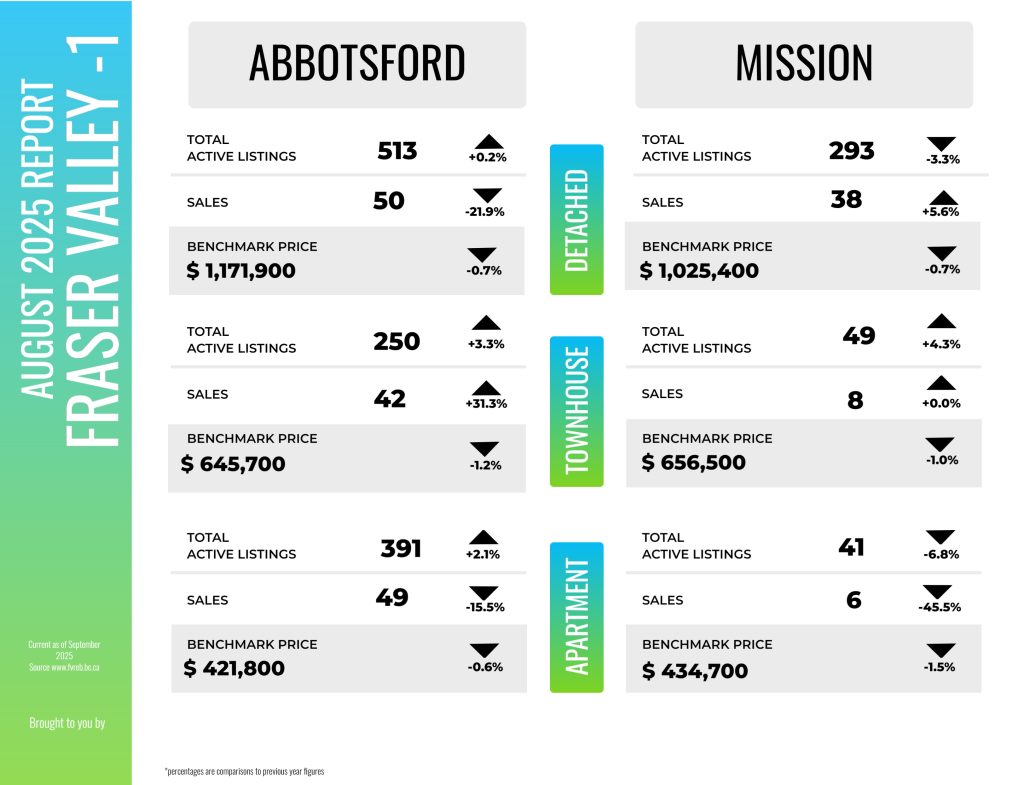
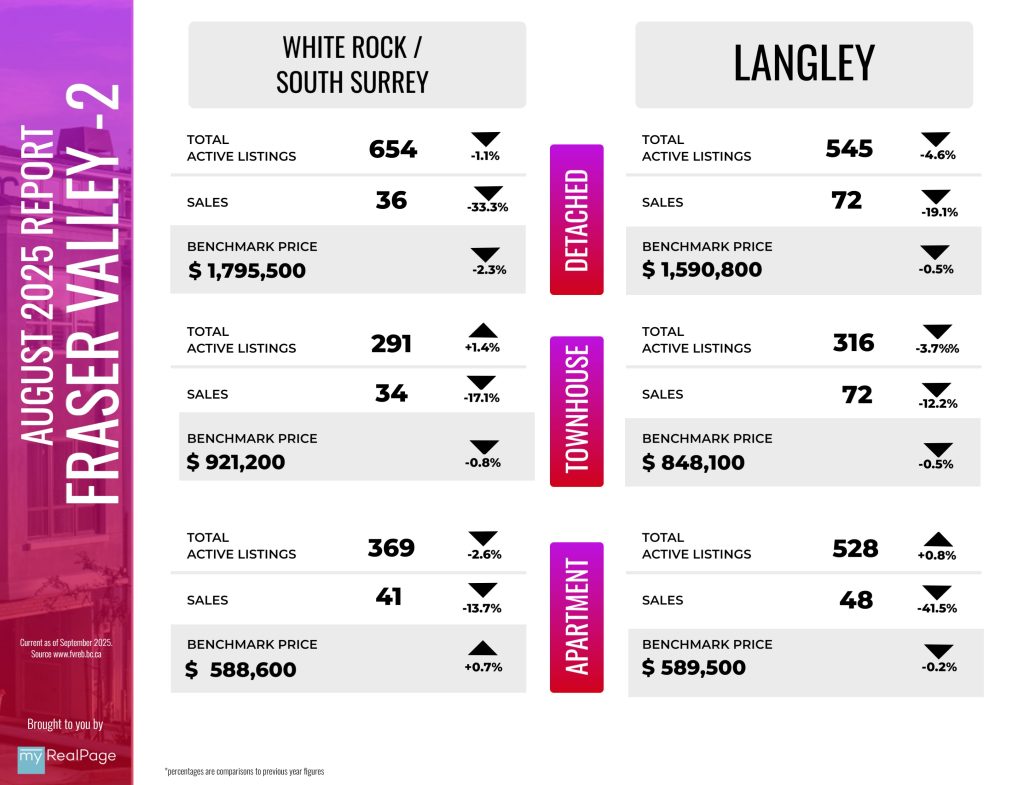
The following data is a comparison between August 2025 and August 2024 numbers, and is current as of September of 2025. For last month’s report, check out our previous infographic!
Or follow this link for all our FVREB Infographics!
These infographics cover current trends in Fraser Valley neighbourhoods that are within the FVREB. Click on the images for a larger view!
Download Printable Version – FVREB August 2025 Market Report
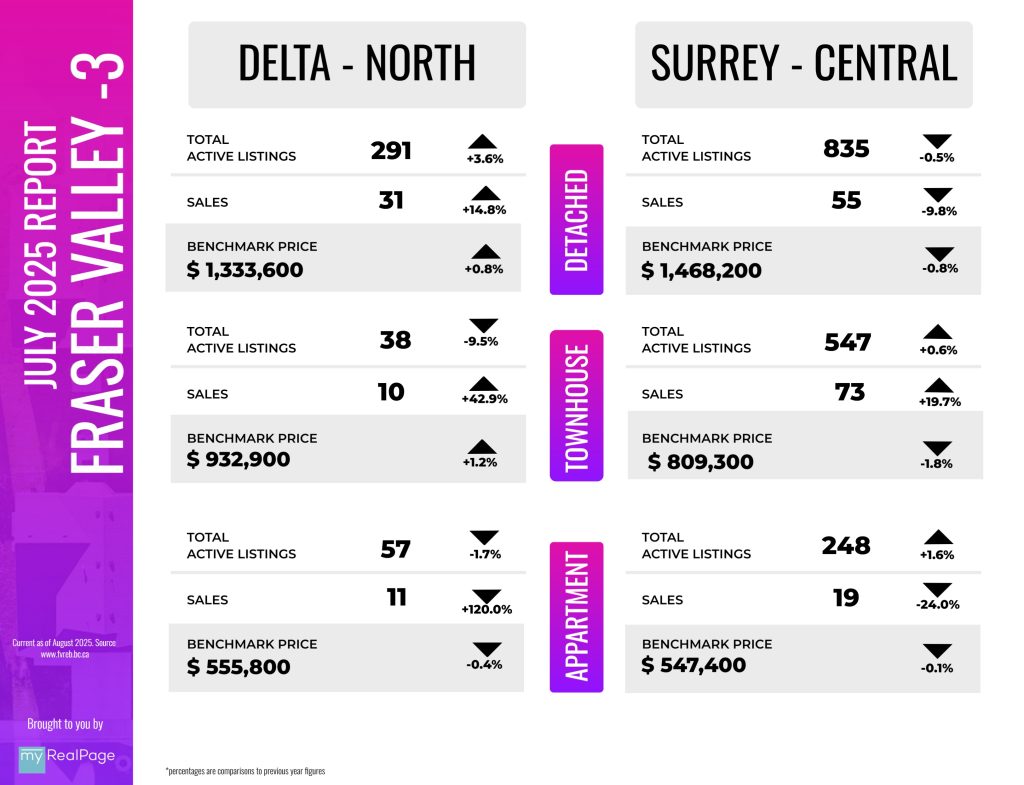
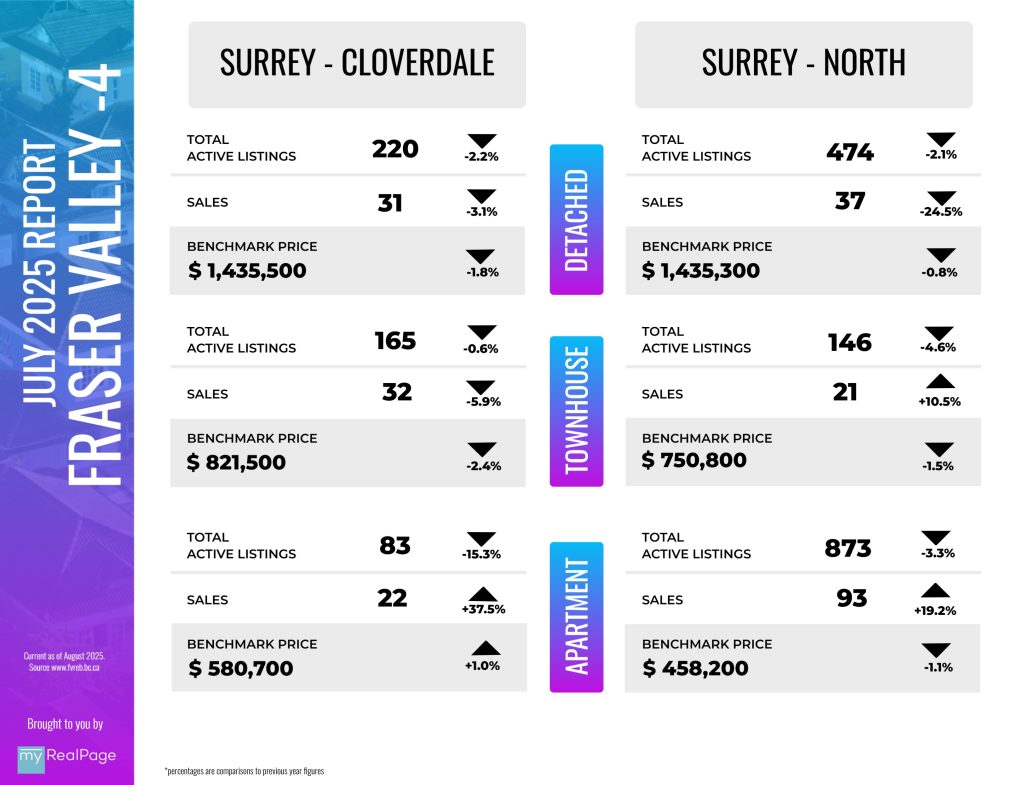
INFOGRAPHICS: July 2025 FVREB Fraser Valley Market Reports

Fraser Valley real estate sales activity levels off as market enters seasonal slowdown
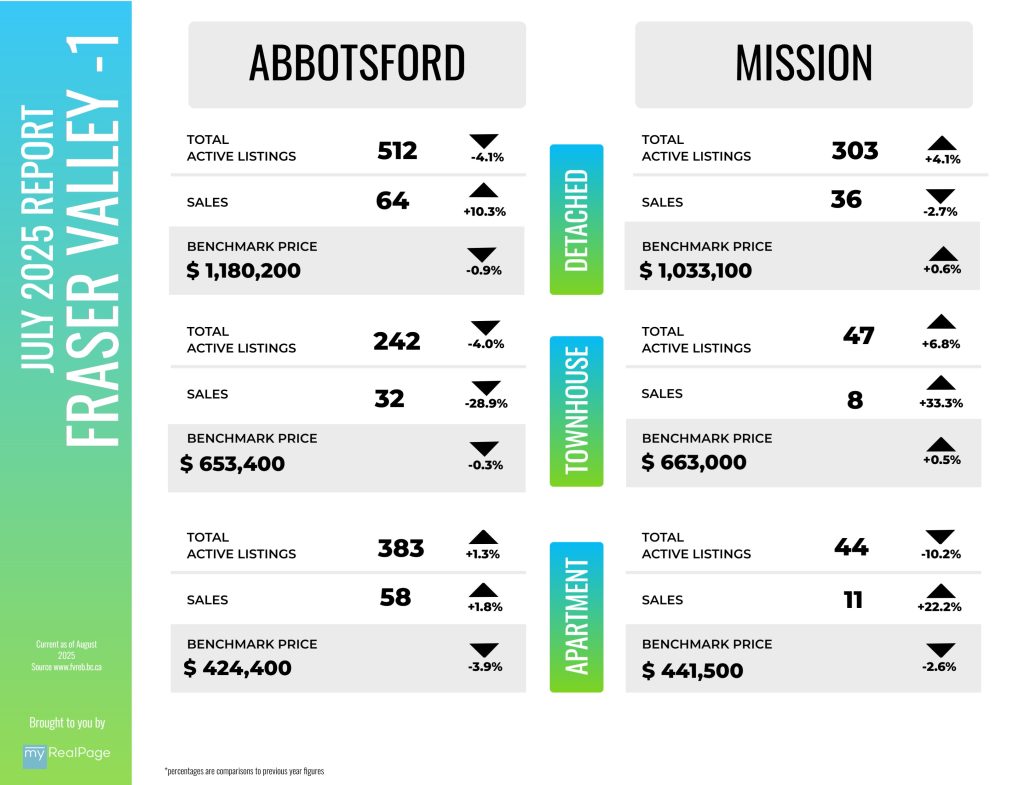
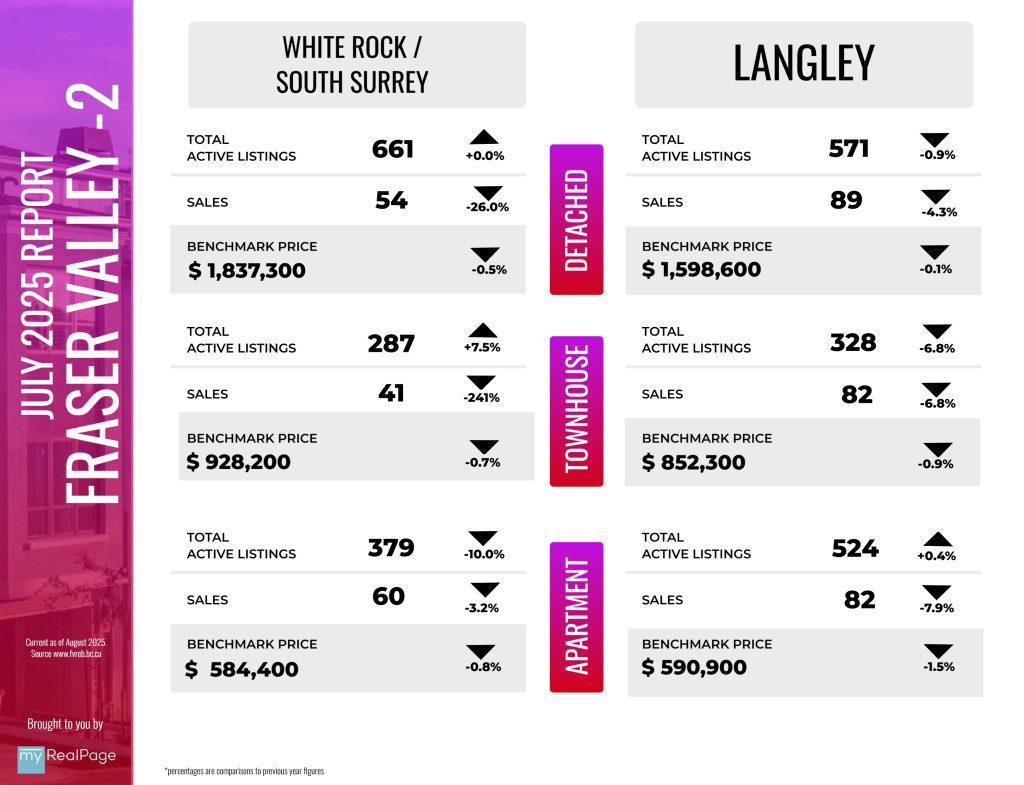
Market conditions are ideal for Fraser Valley home buyers this summer, but the persistent gap between buyers’ and sellers’ price expectations continues to suppress sales. The Fraser Valley Real Estate Board recorded 1,190 sales on its Multiple Listing Service® (MLS®) in July, down half a per cent from June and down three per cent year-over-year. July sales were 23 per cent below the 10-year average.
The supply of homes for sale dipped slightly in July, down two per cent from June to 10,650, nearly 50 per cent above the 10-year seasonal average. New listings declined five per cent over June to 3,453. The Fraser Valley remains in a buyer’s market with an overall sales-to-active listings ratio of 11 per cent; the market is considered balanced when the ratio is between 12 per cent and 20 per cent.
“Home sellers are having to work harder than they did a year or two ago,” said Tore Jacobsen, Chair of the Fraser Valley Real Estate Board. “In a market where buyers are cautious and have ample choice, successful sellers are going the extra mile to meet buyers where they’re at—staging their home, handling repairs up front, and most importantly, pricing their homes realistically for the current market conditions.”
Read the full report on the FVREB website!
The following data is a comparison between July 2025 and July 2024 numbers, and is current as of August of 2025. For last month’s report, check out our previous infographic!
Or follow this link for all our FVREB Infographics!
These infographics cover current trends in Fraser Valley neighbourhoods that are within the FVREB. Click on the images for a larger view!
Download Printable Version – FVREB July 2025 Market Report
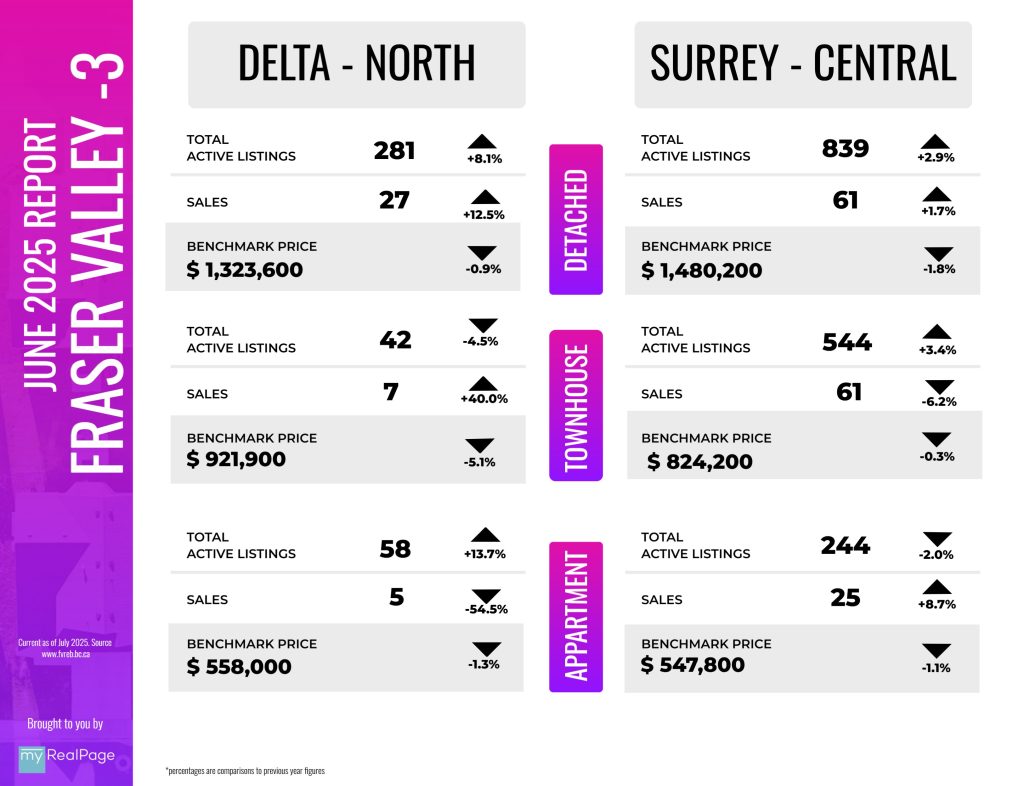
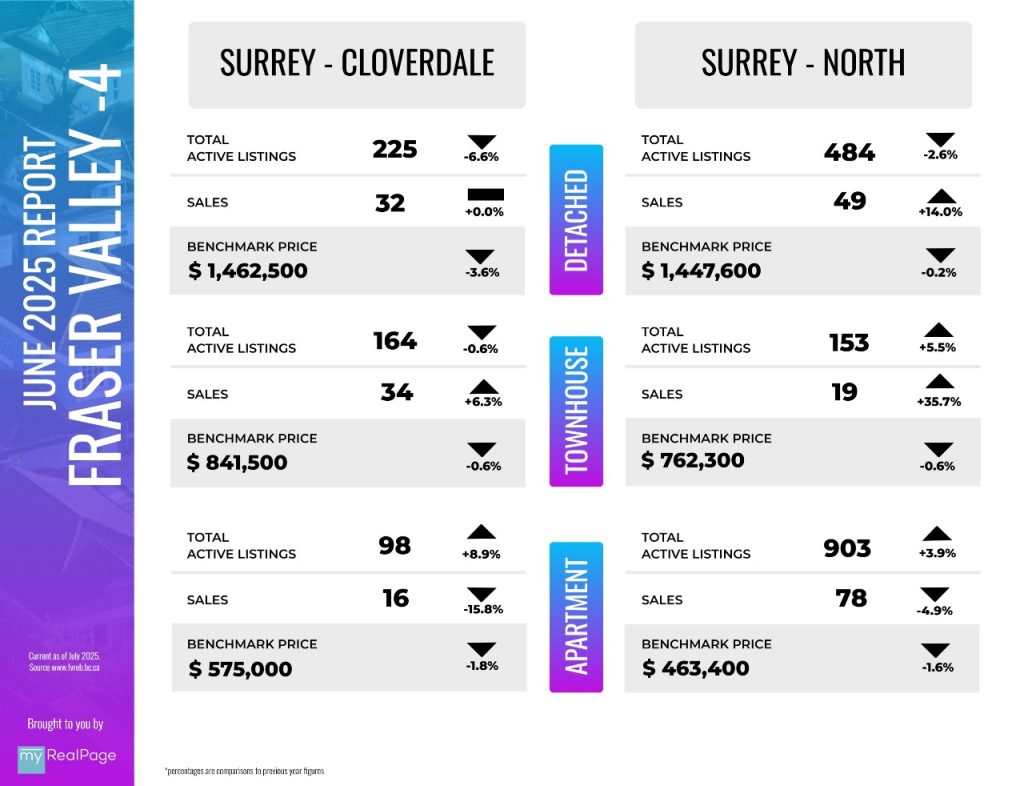
INFOGRAPHICS: June 2025 FVREB Fraser Valley Market Reports

Buying opportunities remain untapped in Fraser Valley real estate market
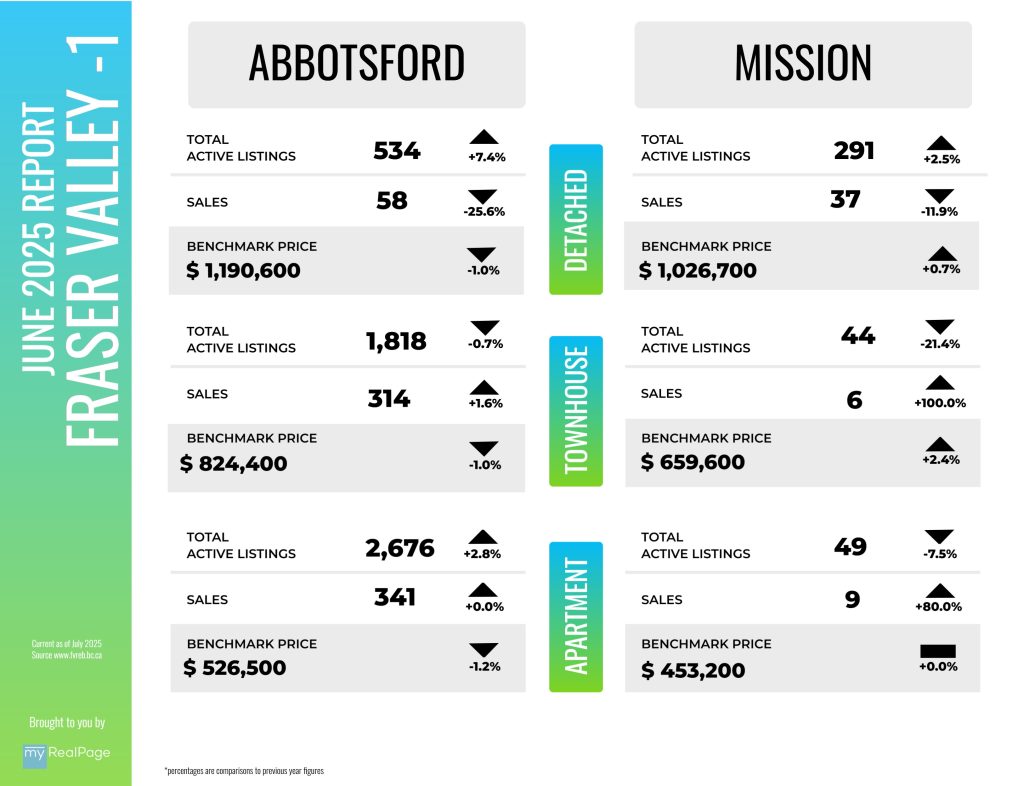
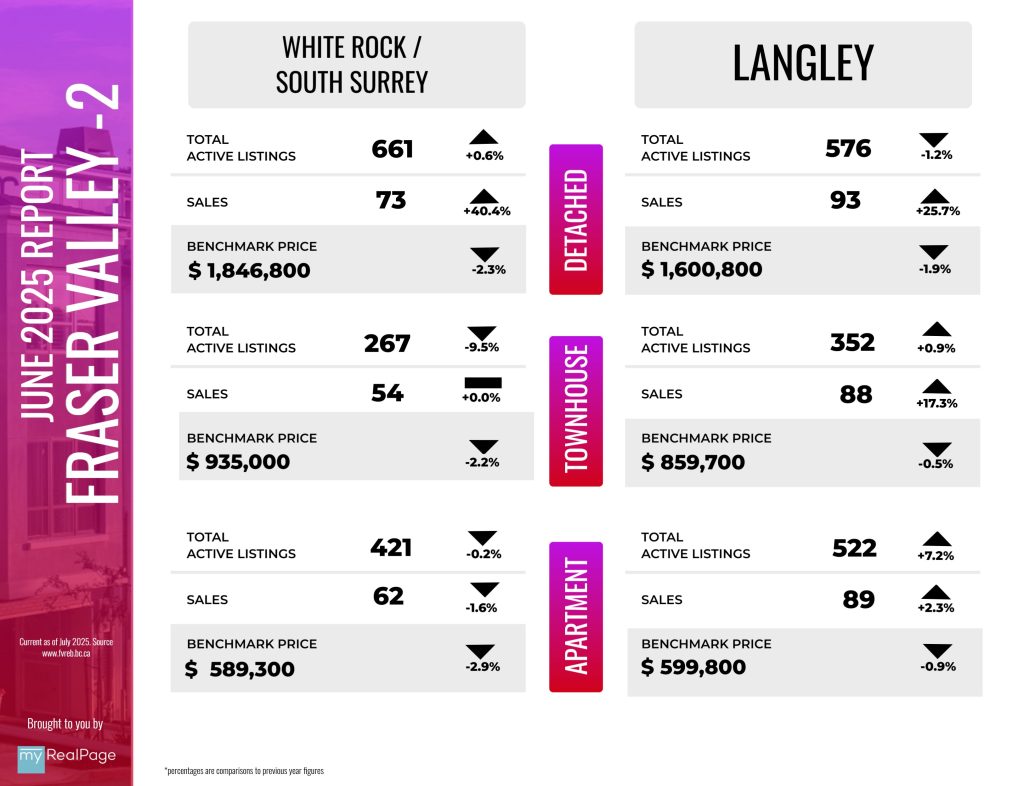
Economic uncertainty continued to be the main driver in buying decisions as home sales in the Fraser Valley remain mostly unchanged, despite abundant inventory and lower prices. The Fraser Valley Real Estate Board recorded 1,195 sales on its Multiple Listing Service® (MLS®) in June, up one per cent from May, but nine per cent below sales from June 2024 and 33 per cent below the 10-year average.
The Fraser Valley remains in a buyer’s market with the supply of available homes continuing to build. Active listings approached 11,000 in June — a two per cent increase over May and 30 per cent above levels from this time last year. New listings declined 10 per cent over May to 3,618. The overall sales-to-active listings ratio is steady at 11 per cent; the market is considered balanced when the ratio is between 12 per cent and 20 per cent.
Read the full report on the FVREB website!
The following data is a comparison between June 2025 and June 2024 numbers, and is current as of July of 2025. For last month’s report, check out our previous infographic!
Or follow this link for all our FVREB Infographics!
These infographics cover current trends in Fraser Valley neighbourhoods that are within the FVREB. Click on the images for a larger view!
Download Printable Version – FVREB June 2025 Market Report
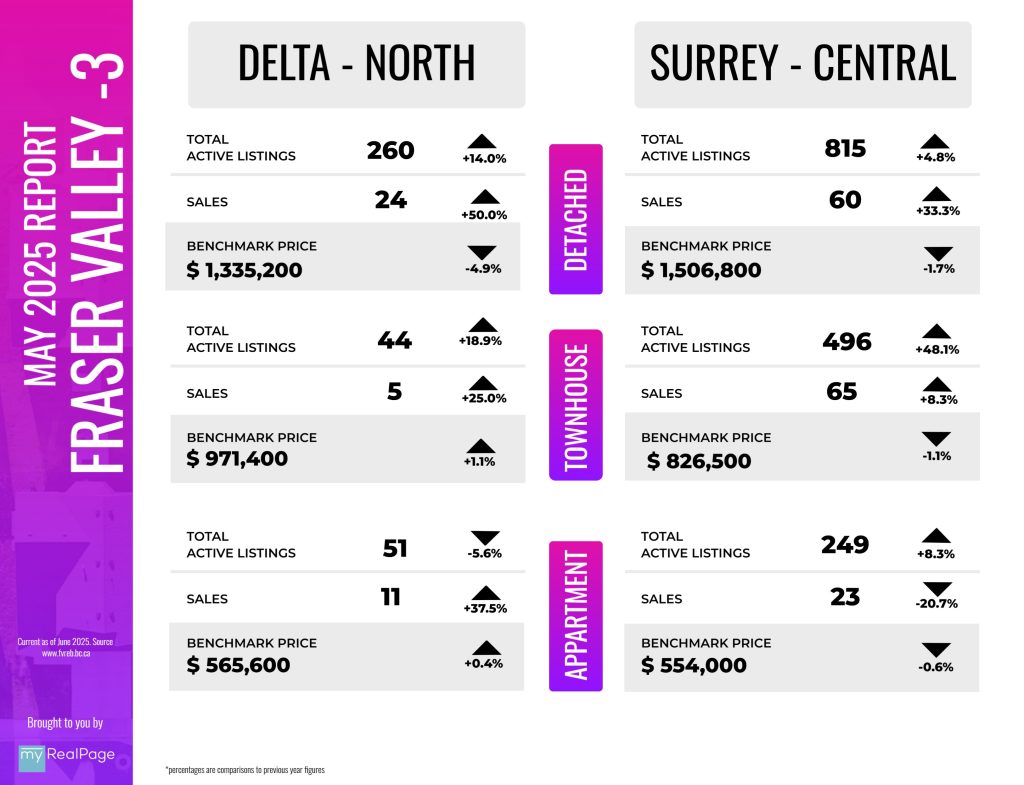
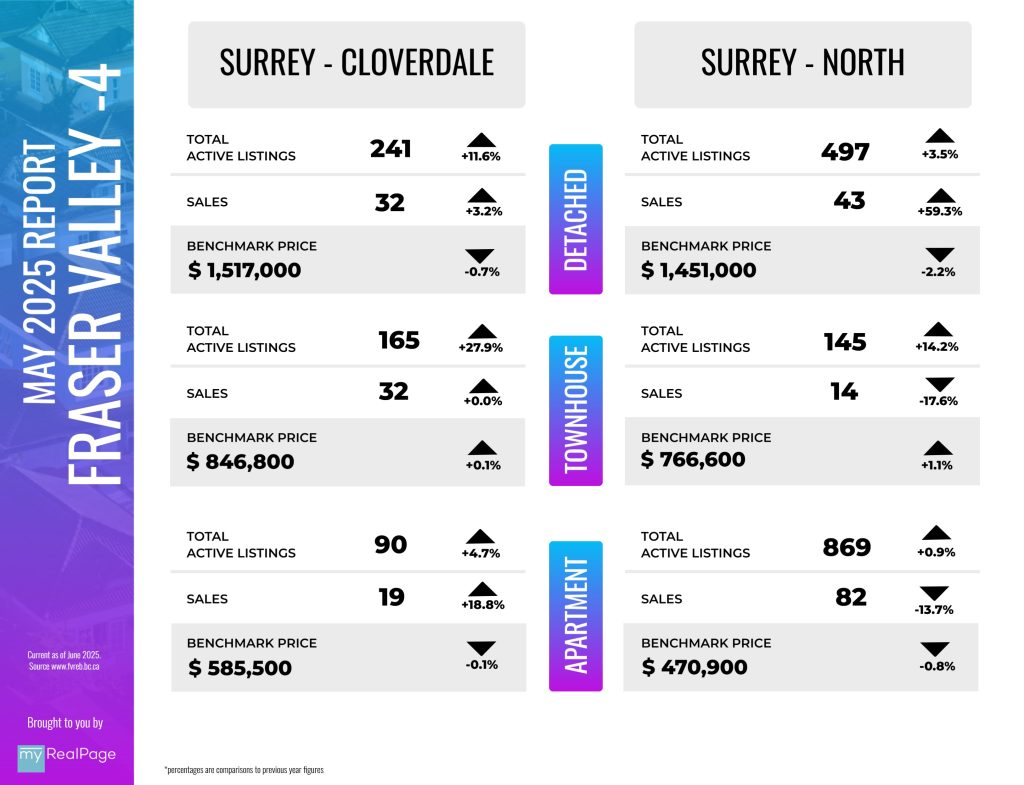
INFOGRAPHICS: May 2025 FVREB Fraser Valley Market Reports

May brings much-needed lift to Fraser Valley housing markety
On the heels of a quiet April, Fraser Valley home sales saw a modest but encouraging uptick in May — a sign that buyer confidence may slowly be returning to the market. The Fraser Valley Real Estate Board recorded 1,183 sales on its Multiple Listing Service® (MLS®) in May, up 13 per cent from April. Despite the increase, sales were 22 per cent below May 2024 levels and 36 per cent below the 10-year seasonal average.
Overall inventory continues to build, with active listings up six per cent in May, to 10,626, an increase of 34 per cent year-over-year and 54 per cent above the 10-year seasonal average. New listings increased seven per cent from April to May to 4,007.
“Compared to last year, easing sales and rising inventories are consistent trends across many cities, as uncertainty continues to weigh on housing demand. However, prior to the economic uncertainty, Calgary was dealing with seller market conditions, and the recent pullbacks in sales and inventory have helped shift us toward balanced conditions taking the pressure off prices,” said Ann-Marie Lurie, Chief Economist at CREB®. “This is a different situation from some of the other larger cities, where their housing markets were struggling prior to the addition of economic uncertainty.”
Read the full report on the FVREB website!
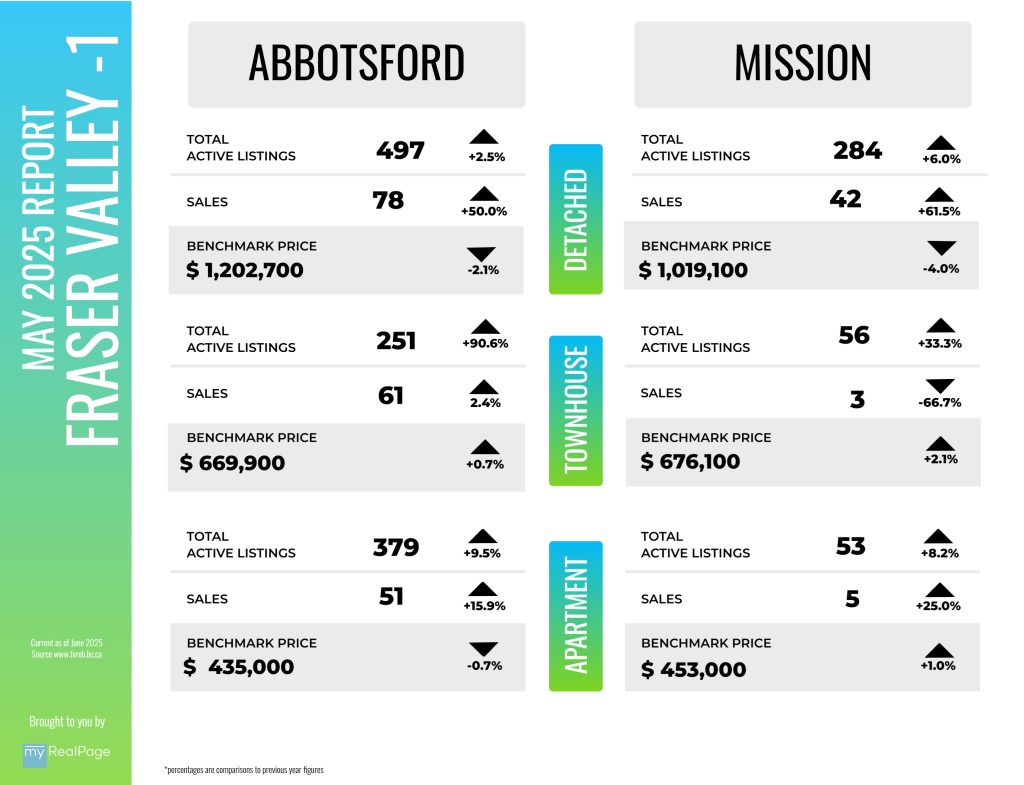
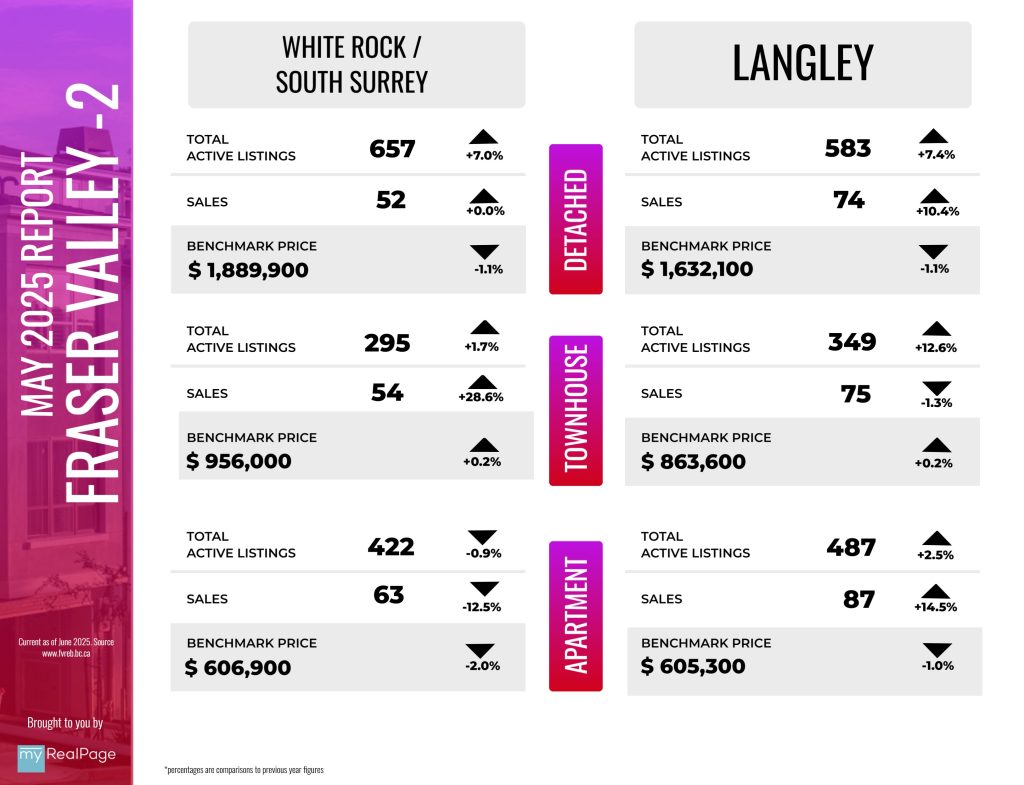
The following data is a comparison between May 2025 and May 2024 numbers, and is current as of June of 2025. For last month’s report, check out our previous infographic!
Or follow this link for all our FVREB Infographics!
These infographics cover current trends in Fraser Valley neighbourhoods that are within the FVREB. Click on the images for a larger view!
Download Printable Version – FVREB May 2025 Market Report
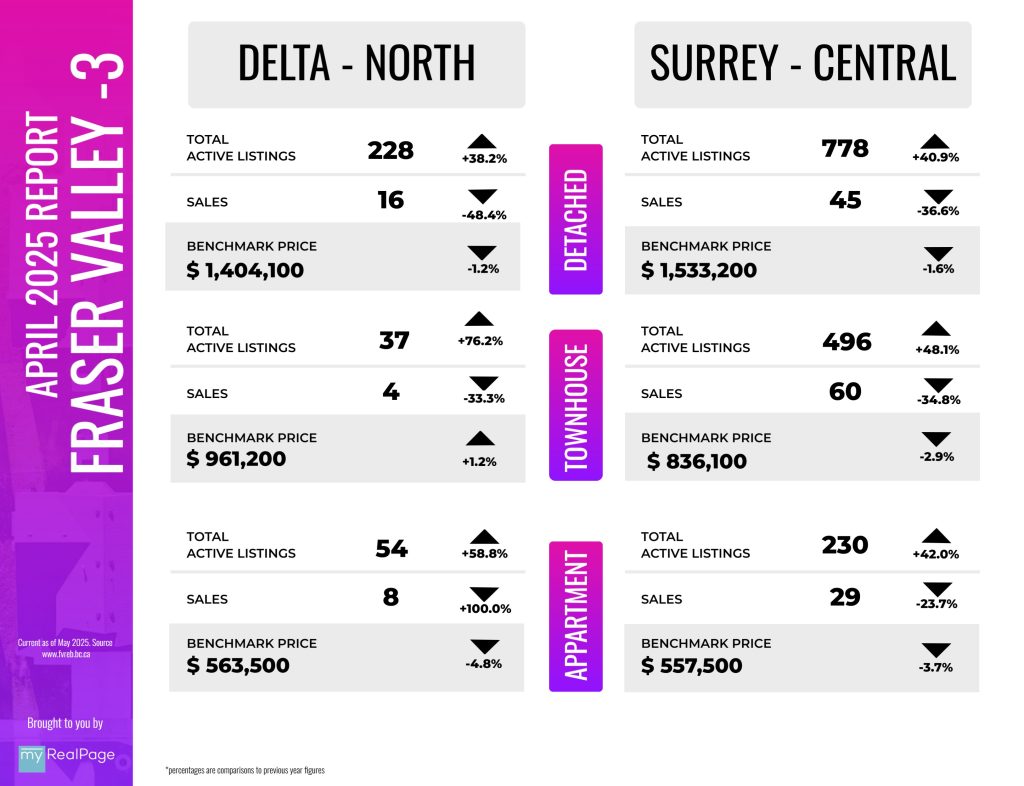
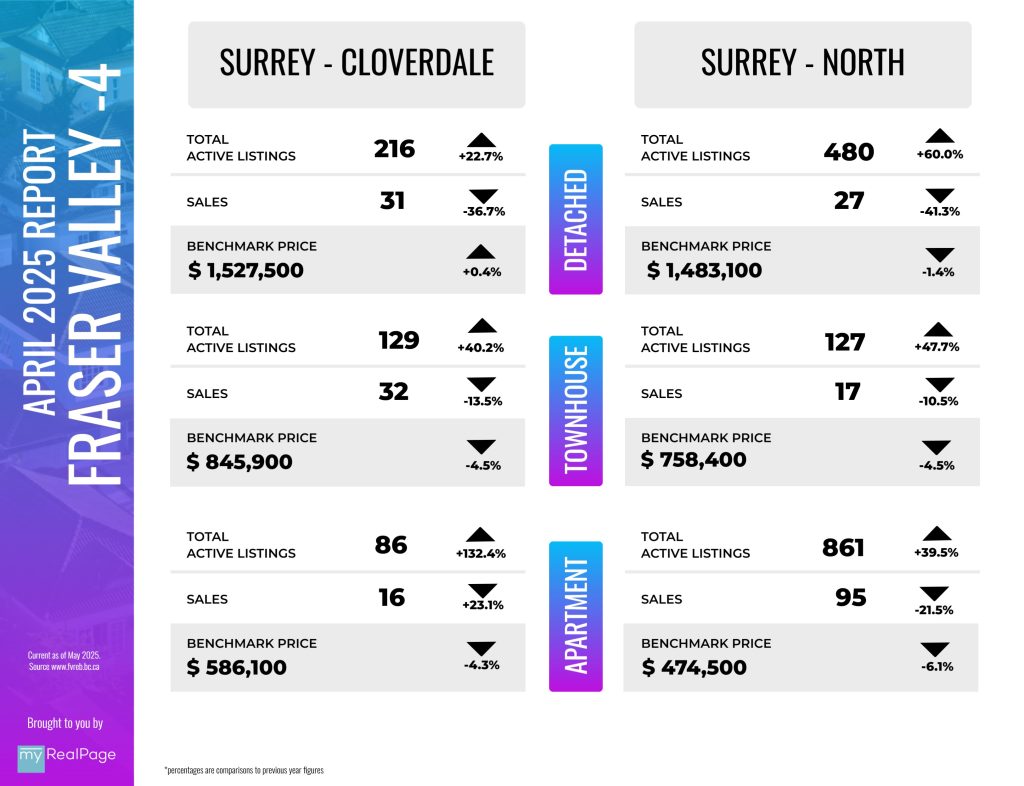
INFOGRAPHICS: April 2025 FVREB Fraser Valley Market Reports

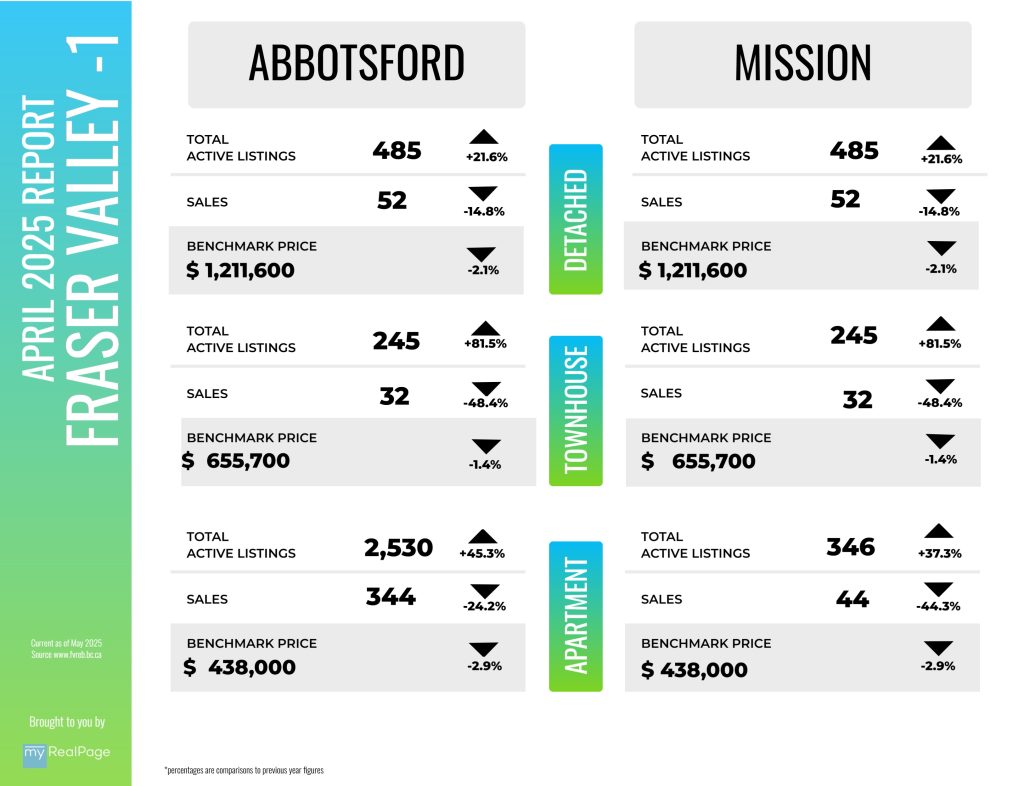
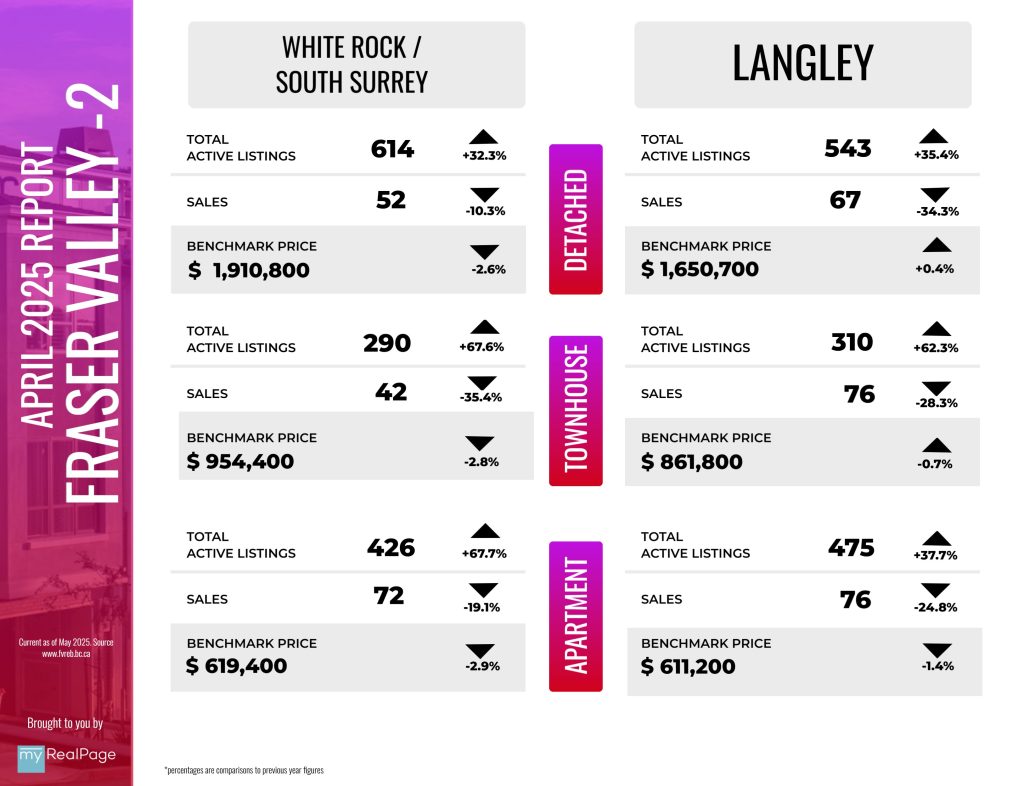
Abundant listings and stable prices not enough to drive April sales in the Fraser Valley
Home buyers in the Fraser Valley are enjoying a selection of homes for sale not seen in more than a decade. The growing inventory of more than 10,000 active listings means, in many cases, that buyers have time, selection and price negotiation on their side.
“There’s definitely a surge of activity in the market — buyers are out viewing homes and attending open houses,” said Tore Jacobsen, Chair of the Fraser Valley Real Estate Board. “What’s noticeable in the current market is the level of choice. A buyer might see a home they like and then have an opportunity to tour five or ten more just like it, without feeling rushed to make an immediate offer.”
However, despite the abundance of listings and potential buying opportunities, spring sales remain sluggish. The Fraser Valley Real Estate Board recorded 1,043 sales on its Multiple Listing Service® (MLS®) in April, up one per cent from March and down 29 per cent year over year. New listings declined slightly in April, down one per cent from March.
Read the full report on the FVREB website!
The following data is a comparison between April 2025 and April 2024 numbers, and is current as of May of 2025. For last month’s report, check out our previous infographic!
Or follow this link for all our FVREB Infographics!
These infographics cover current trends in Fraser Valley neighbourhoods that are within the FVREB. Click on the images for a larger view!
Download Printable Version – FVREB April 2025 Market Report
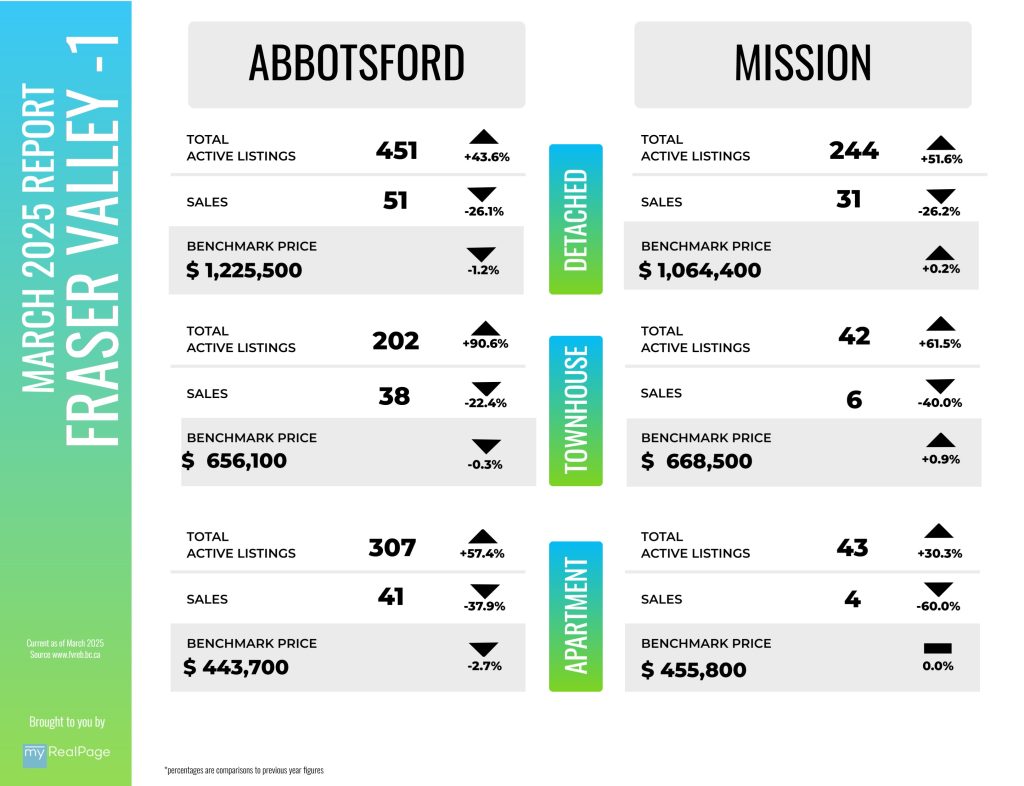
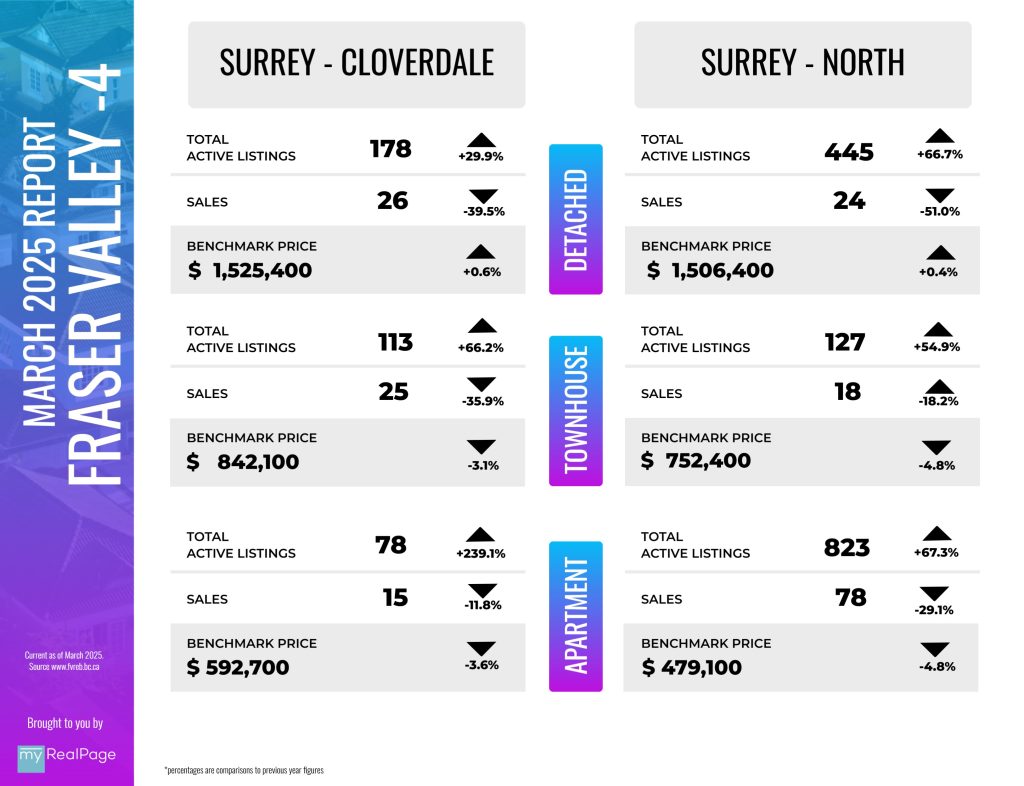
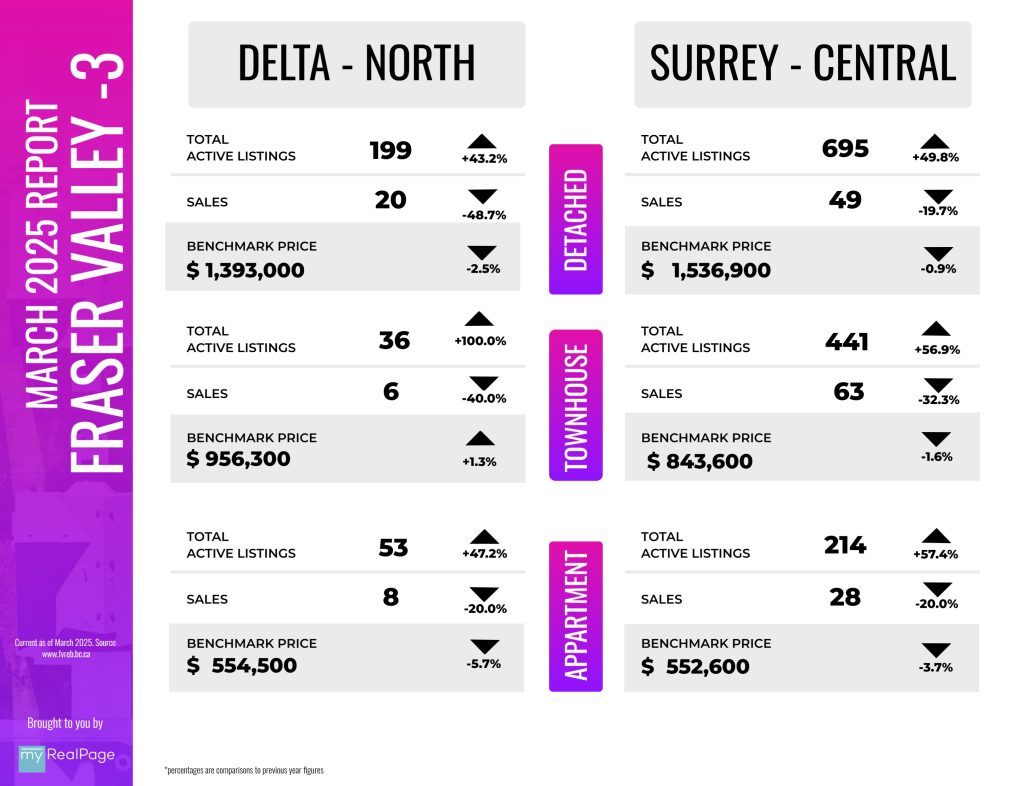
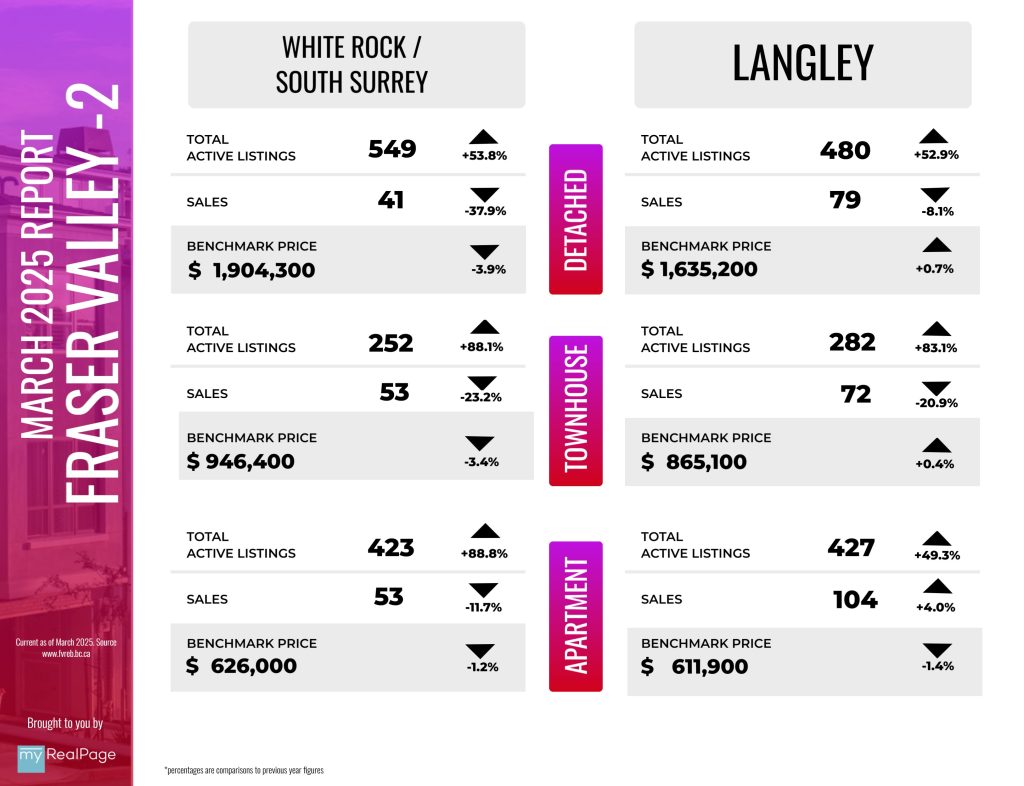
INFOGRAPHICS: March 2025 FVREB Fraser Valley Market Reports

Tariffs, economic uncertainty stall spring market in the Fraser Valley
March home sales in the Fraser Valley remained nearly 50 per cent below the 10-year average — making for the slowest start to the spring market in more than 15 years.
The Fraser Valley Real Estate Board recorded 1,036 sales in March, up 13 per cent from February, but still 26 per cent below sales recorded this time last year. Following a decline on the Board’s Multiple Listing Service® (MLS®) in February, new listings increased 22 per cent in March to 3,800. Overall inventory is at a decade-high level, with 9,219 active listings, 49 per cent above March 2024 and 59 per cent above the 10-year seasonal average.
“If not for the economic uncertainty driven largely by U.S. tariffs, we’d likely be seeing a typical strong spring market in the Fraser Valley,” said Tore Jacobsen, Chair of the Fraser Valley Real Estate Board. “Instead, we’re seeing a disconnect as sellers remain hesitant to lower their prices beyond a certain threshold, while buyers, facing tighter financing conditions, are either unable or unwilling to meet it. The resulting inertia is keeping sales low.”
Read the full report on the FVREB website!
The following data is a comparison between March 2025 and March 2024 numbers, and is current as of April of 2025. For last month’s report, check out our previous infographic!
Or follow this link for all our FVREB Infographics!
These infographics cover current trends in Fraser Valley neighbourhoods that are within the FVREB. Click on the images for a larger view!
Download Printable Version – FVREB March 2025 Market Report
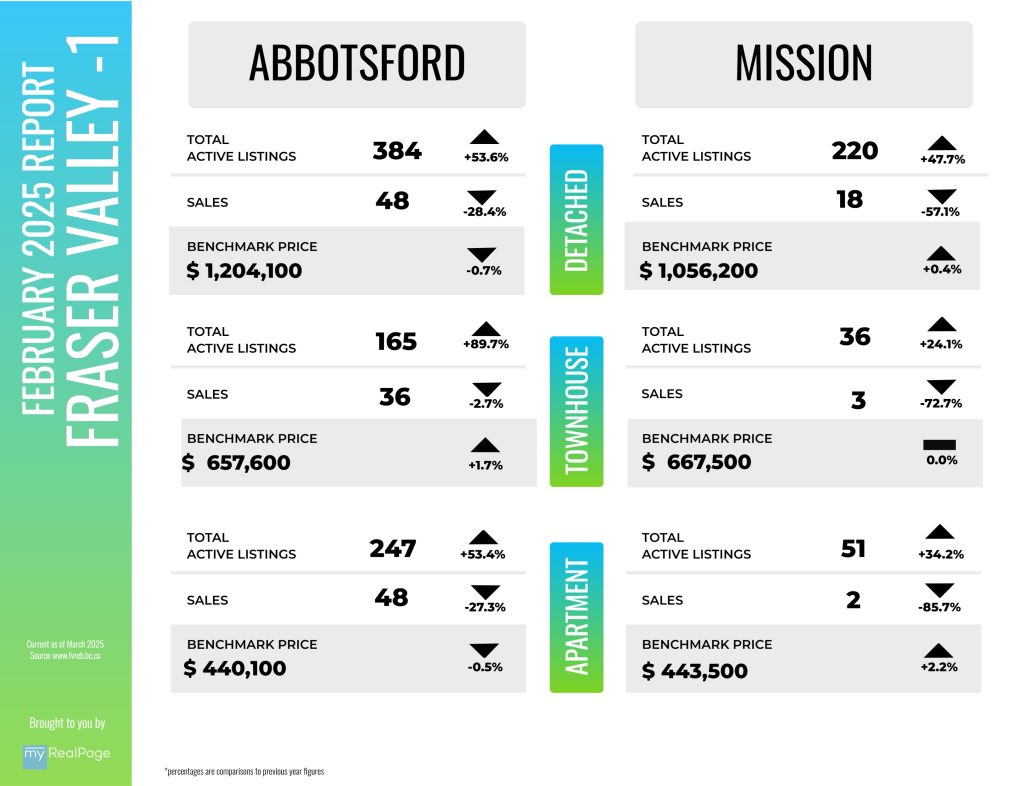
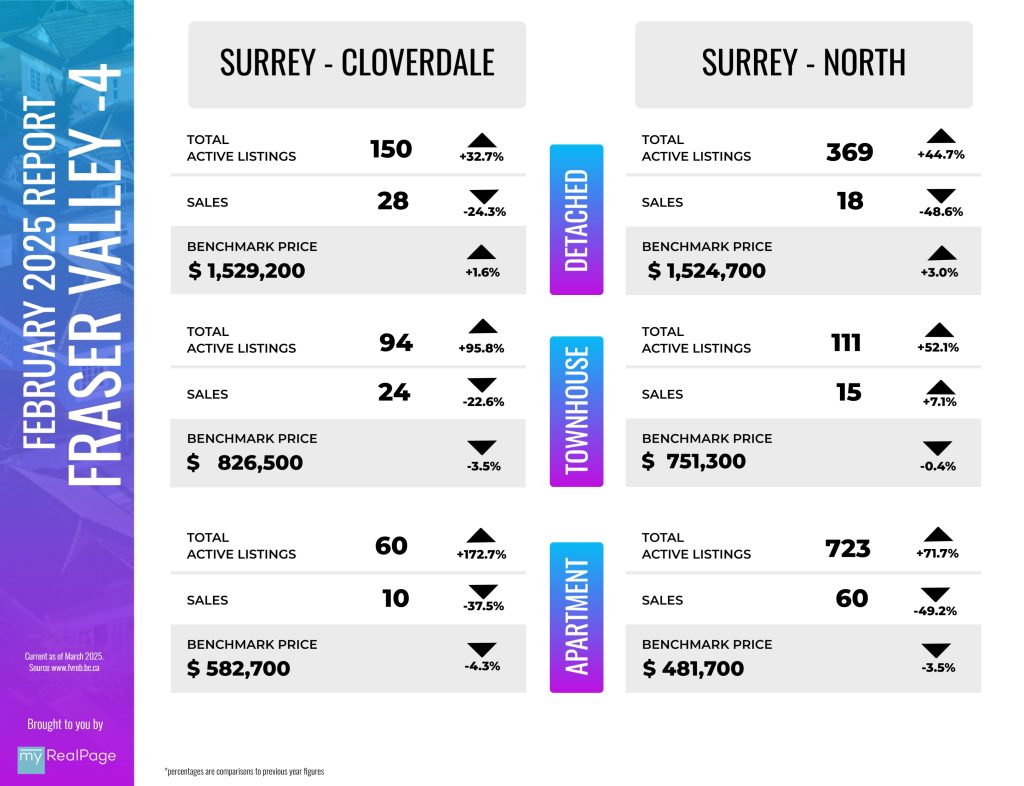
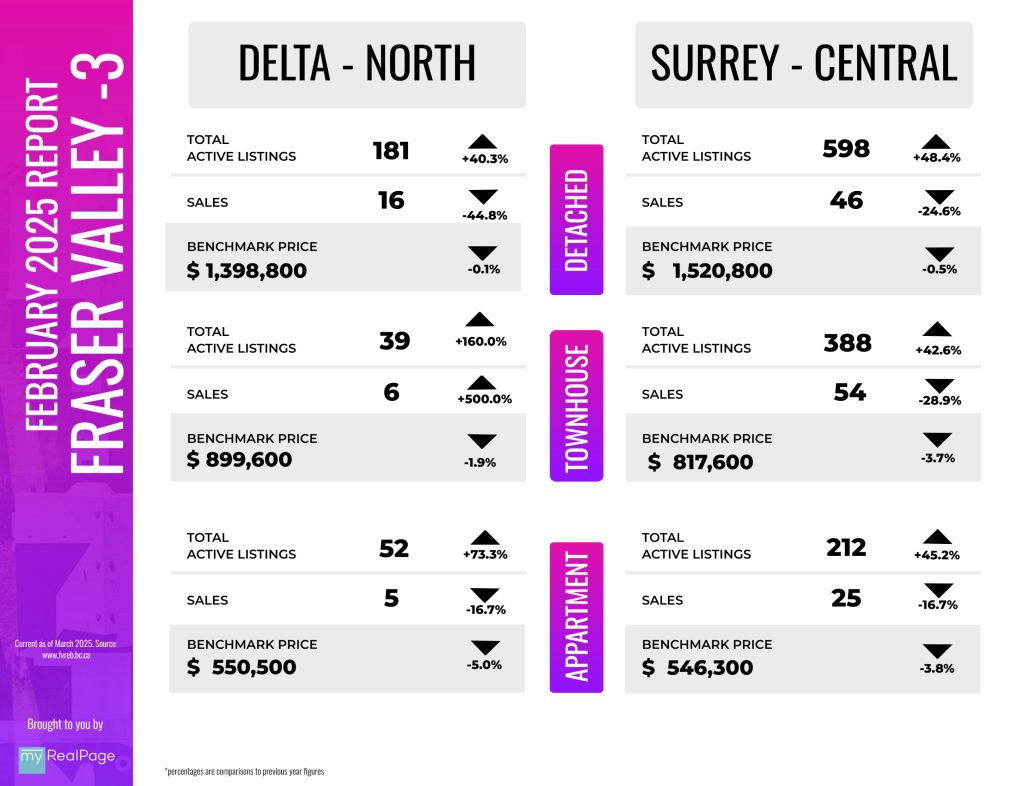
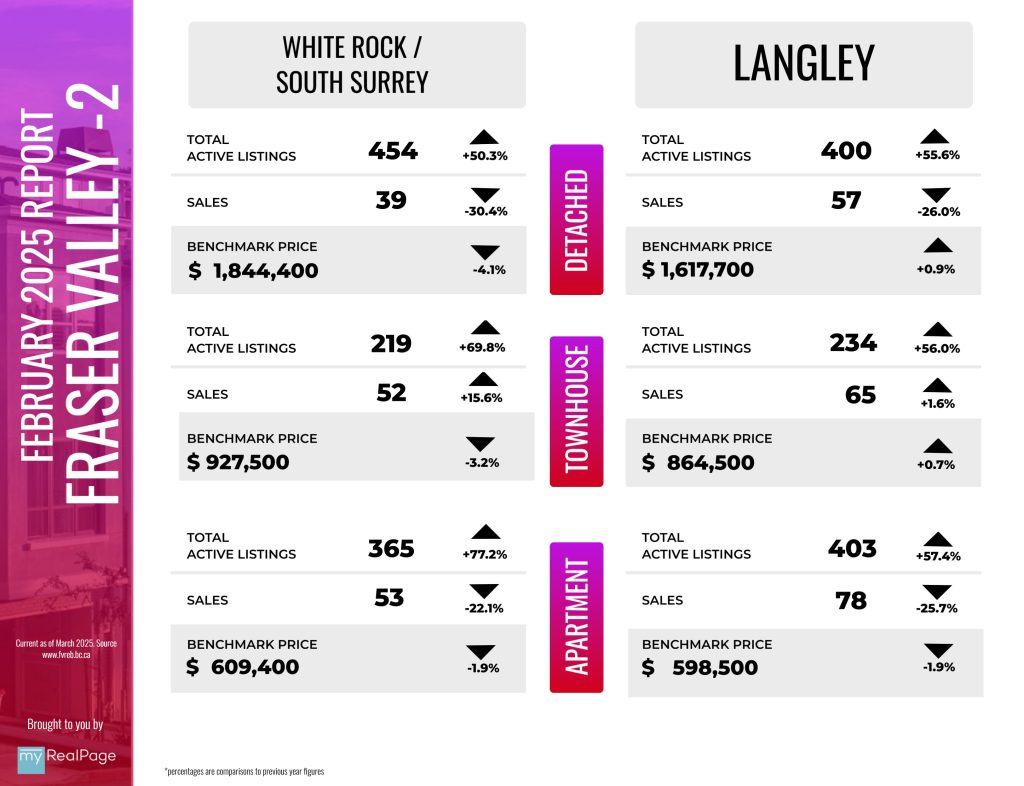
INFOGRAPHICS: February 2025 FVREB Fraser Valley Market Reports

Buyers gaining upper hand in Fraser Valley real estate market
For the first time in four months, home sales in the Fraser Valley have increased as buyers capitalize on more selection and weakening prices.
The Fraser Valley Real Estate Board recorded 920 sales in February, up 13 per cent from January, but 26 per cent below sales recorded in February 2024. Despite a nine per cent drop in newly listed homes on the Board’s Multiple Listing Service® (MLS®), new listings remained 14 per cent above the 10-year seasonal average, at 3,121. Overall inventory remains high, at 8,070 active listings, 45 per cent above February 2024 and 55 per cent above the 10-year seasonal average.
The overall sales-to-active listings ratio continues to signal a buyer’s market in the Fraser Valley, with a ratio of 11 per cent. The market is considered to be balanced with the ratio is between 12 per cent and 20 per cent.
“The combination of inventory accumulation and softening prices is providing buyers with increased leverage, especially in the single-family detached category,” said Baldev Gill, CEO of the Fraser Valley Real Estate Board. “Should this pattern persist, we could see a further shift toward a buyer’s market, particularly given the ongoing economic uncertainties and impending tariffs. With ample selection, buyers have flexibility and time on their side to explore their options before making a decision.”
Read the full report on the FVREB website!
The following data is a comparison between February 2025 and February 2024 numbers, and is current as of March of 2025. For last month’s report, check out our previous infographic!
Or follow this link for all our FVREB Infographics!
These infographics cover current trends in Fraser Valley neighbourhoods that are within the FVREB. Click on the images for a larger view!
Download Printable Version – FVREB February 2025 Market Report
